Open source observability for AWS Inferentia nodes within Amazon EKS clusters
Recent developments in machine learning (ML) have led to increasingly large models, some of which require hundreds of billions of parameters. Although they are more powerful, training and inference on those models require significant computational resources. Despite the availability of advanced distributed training libraries, it’s common for training and inference jobs to need hundreds of accelerators (GPUs or purpose-built ML chips such as AWS Trainium and AWS Inferentia), and therefore tens or hundreds of instances.
In such distributed environments, observability of both instances and ML chips becomes key to model performance fine-tuning and cost optimization. Metrics allow teams to understand workload behavior and optimize resource allocation and utilization, diagnose anomalies, and increase overall infrastructure efficiency. For data scientists, ML chips utilization and saturation are also relevant for capacity planning.
This post walks you through the Open Source Observability pattern for AWS Inferentia, which shows you how to monitor the performance of ML chips, used in an Amazon Elastic Kubernetes Service (Amazon EKS) cluster, with data plane nodes based on Amazon Elastic Compute Cloud (Amazon EC2) instances of type Inf1 and Inf2.
The pattern is part of the AWS CDK Observability Accelerator, a set of opinionated modules to help you set observability for Amazon EKS clusters. The AWS CDK Observability Accelerator is organized around patterns, which are reusable units for deploying multiple resources. The open source observability set of patterns instruments observability with Amazon Managed Grafana dashboards, an AWS Distro for OpenTelemetry collector to collect metrics, and Amazon Managed Service for Prometheus to store them.
Solution overview
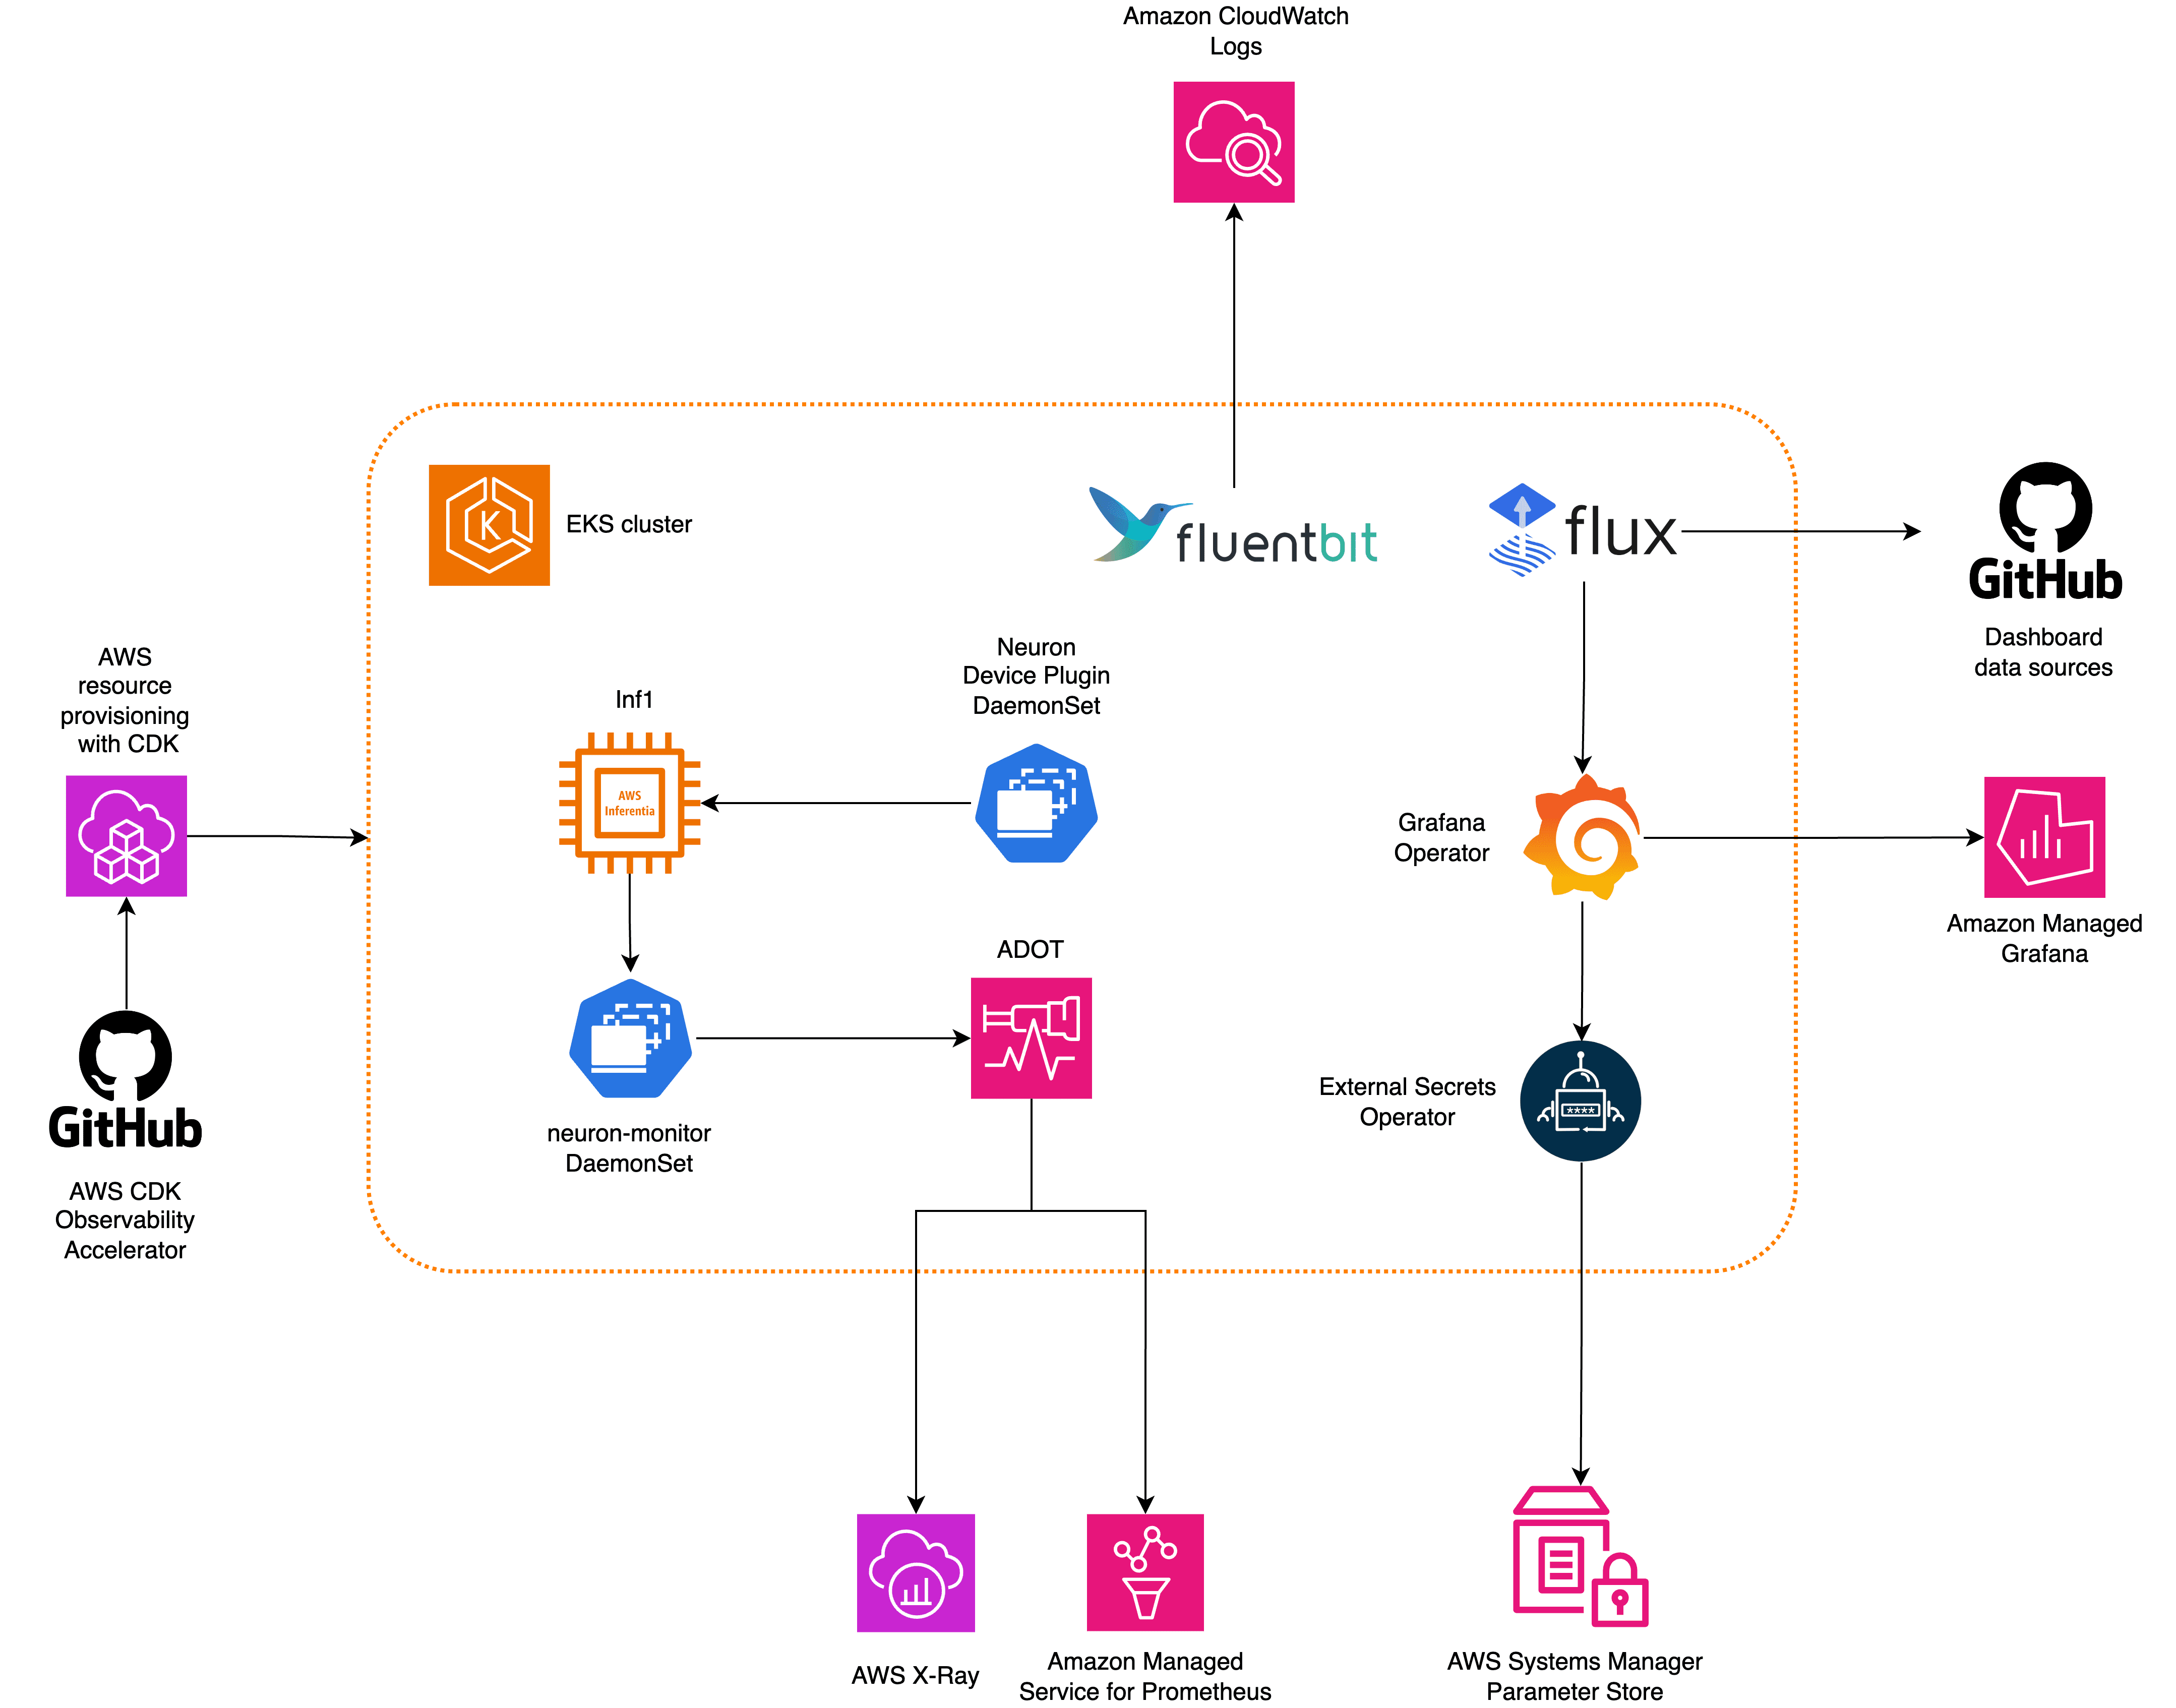
The following diagram illustrates the solution architecture.

This solution deploys an Amazon EKS cluster with a node group that includes Inf1 instances.
The AMI type of the node group is AL2_x86_64_GPU, which uses the Amazon EKS optimized accelerated Amazon Linux AMI. In addition to the standard Amazon EKS-optimized AMI configuration, the accelerated AMI includes the NeuronX runtime.
To access the ML chips from Kubernetes, the pattern deploys the AWS Neuron device plugin.
Metrics are exposed to Amazon Managed Service for Prometheus by the neuron-monitor DaemonSet, which deploys a minimal container, with the Neuron tools installed. Specifically, the neuron-monitor DaemonSet runs the neuron-monitor command piped into the neuron-monitor-prometheus.py companion script (both commands are part of the container):
The command uses the following components:
neuron-monitorcollects metrics and stats from the Neuron applications running on the system and streams the collected data to stdout in JSON formatneuron-monitor-prometheus.pymaps and exposes the telemetry data from JSON format into Prometheus-compatible format
Data is visualized in Amazon Managed Grafana by the corresponding dashboard.
The rest of the setup to collect and visualize metrics with Amazon Managed Service for Prometheus and Amazon Managed Grafana is similar to that used in other open source based patterns, which are included in the AWS Observability Accelerator for CDK GitHub repository.
Prerequisites
You need the following to complete the steps in this post:
- The AWS Command Line Interface (AWS CLI) installed
- The AWS Cloud Development Kit (AWS CDK) installed, using version 2.86.0 or later
- Homebrew to install required packages for macOS or Linux
- An existing Amazon Managed Grafana workspace (if you don’t have one, you can create it on the Amazon Managed Grafana console or with the following commands)
- Node version 20.0.0 or later
- NPM version 10.0.0 or later
- Kubectl
- Git
- Make
Set up the environment
Complete the following steps to set up your environment:
- Open a terminal window and run the following commands:
- Retrieve the workspace IDs of any existing Amazon Managed Grafana workspace:
The following is our sample output:
- Assign the values of
idandendpointto the following environment variables:
COA_AMG_ENDPOINT_URL needs to include https://.
- Create a Grafana API key from the Amazon Managed Grafana workspace:
- Set up a secret in AWS Systems Manager:
The secret will be accessed by the External Secrets add-on and made available as a native Kubernetes secret in the EKS cluster.
Bootstrap the AWS CDK environment
The first step to any AWS CDK deployment is bootstrapping the environment. You use the cdk bootstrap command in the AWS CDK CLI to prepare the environment (a combination of AWS account and AWS Region) with resources required by AWS CDK to perform deployments into that environment. AWS CDK bootstrapping is needed for each account and Region combination, so if you already bootstrapped AWS CDK in a Region, you don’t need to repeat the bootstrapping process.
Deploy the solution
Complete the following steps to deploy the solution:
- Clone the cdk-aws-observability-accelerator repository and install the dependency packages. This repository contains AWS CDK v2 code written in TypeScript.
The actual settings for Grafana dashboard JSON files are expected to be specified in the AWS CDK context. You need to update context in the cdk.json file, located in the current directory. The location of the dashboard is specified by the fluxRepository.values.GRAFANA_NEURON_DASH_URL parameter, and neuronNodeGroup is used to set the instance type, number, and Amazon Elastic Block Store (Amazon EBS) size used for the nodes.
- Enter the following snippet into
cdk.json, replacingcontext:
You can replace the Inf1 instance type with Inf2 and change the size as needed. To check availability in your selected Region, run the following command (amend Values as you see fit):
- Install the project dependencies:
- Run the following commands to deploy the open source observability pattern:
Validate the solution
Complete the following steps to validate the solution:
- Run the
update-kubeconfigcommand. You should be able to get the command from the output message of the previous command:
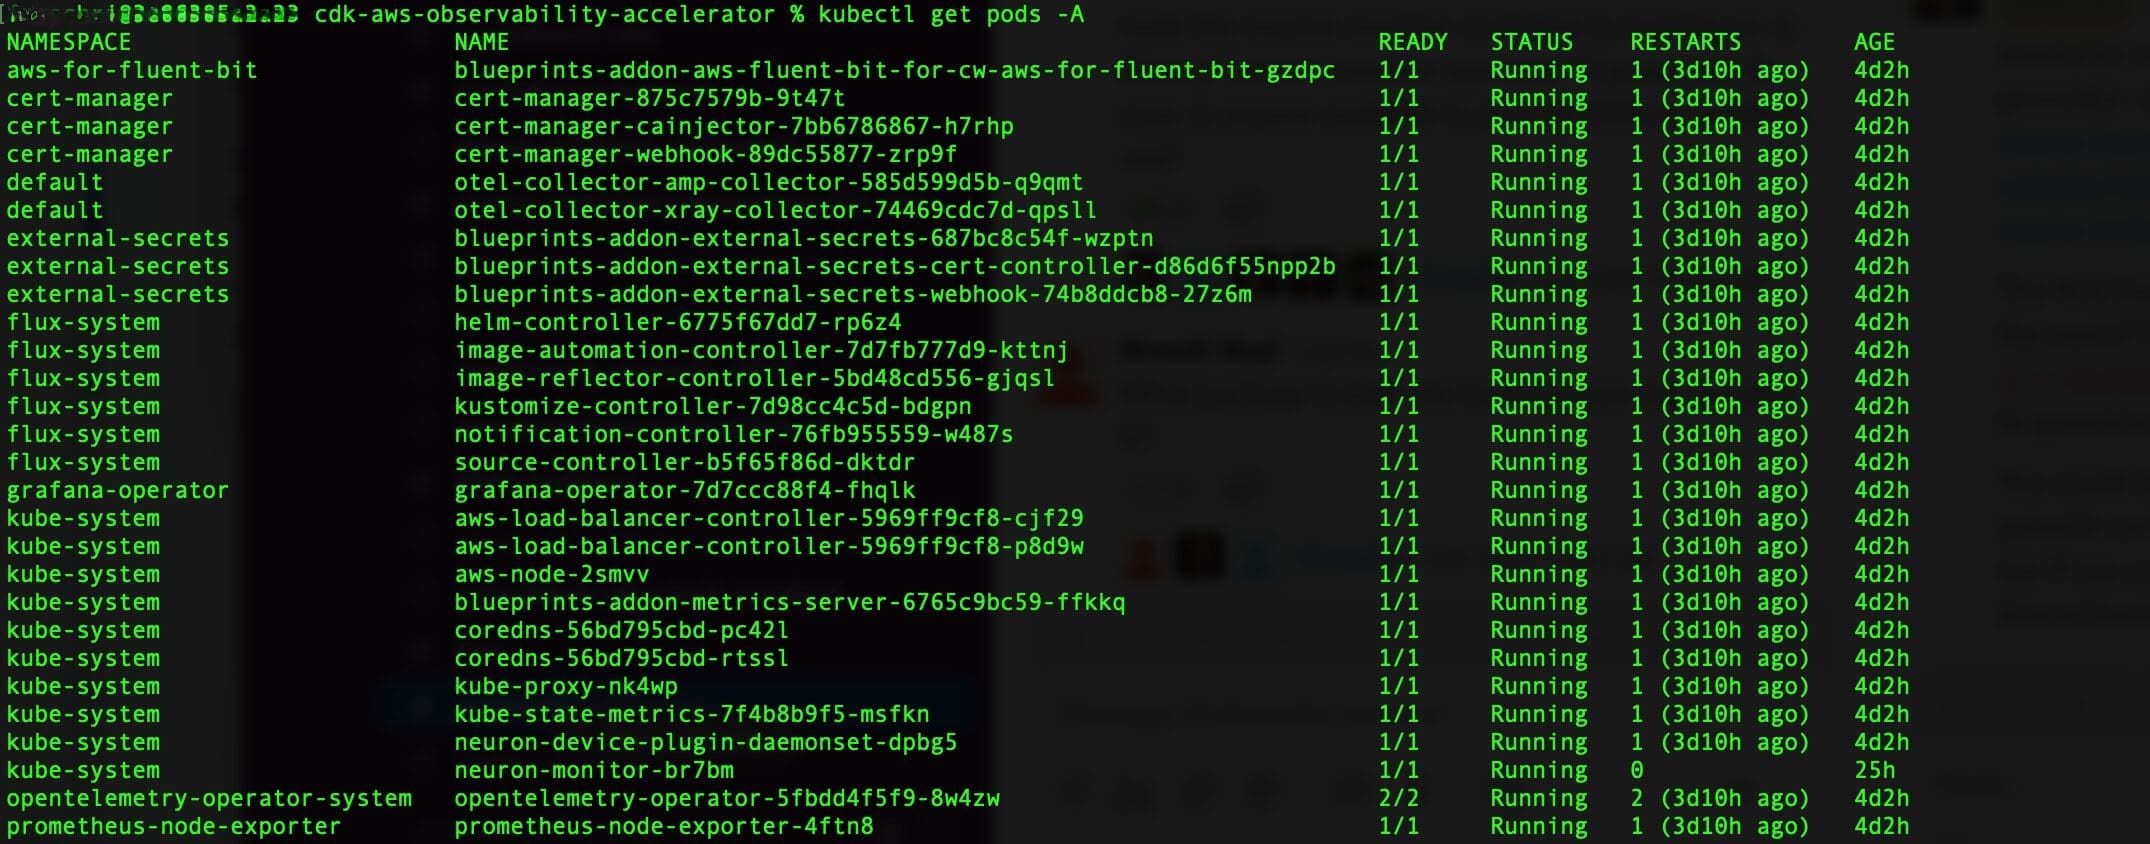
- Verify the resources you created:
The following screenshot shows our sample output.

- Make sure the
neuron-device-plugin-daemonsetDaemonSet is running:
The following is our expected output:
- Confirm that the
neuron-monitorDaemonSet is running:
The following is our expected output:
- To verify that the Neuron devices and cores are visible, run the
neuron-lsandneuron-topcommands from, for example, your neuron-monitor pod (you can get the pod’s name from the output ofkubectl get pods -A):
The following screenshot shows our expected output.

The following screenshot shows our expected output.

Visualize data using the Grafana Neuron dashboard
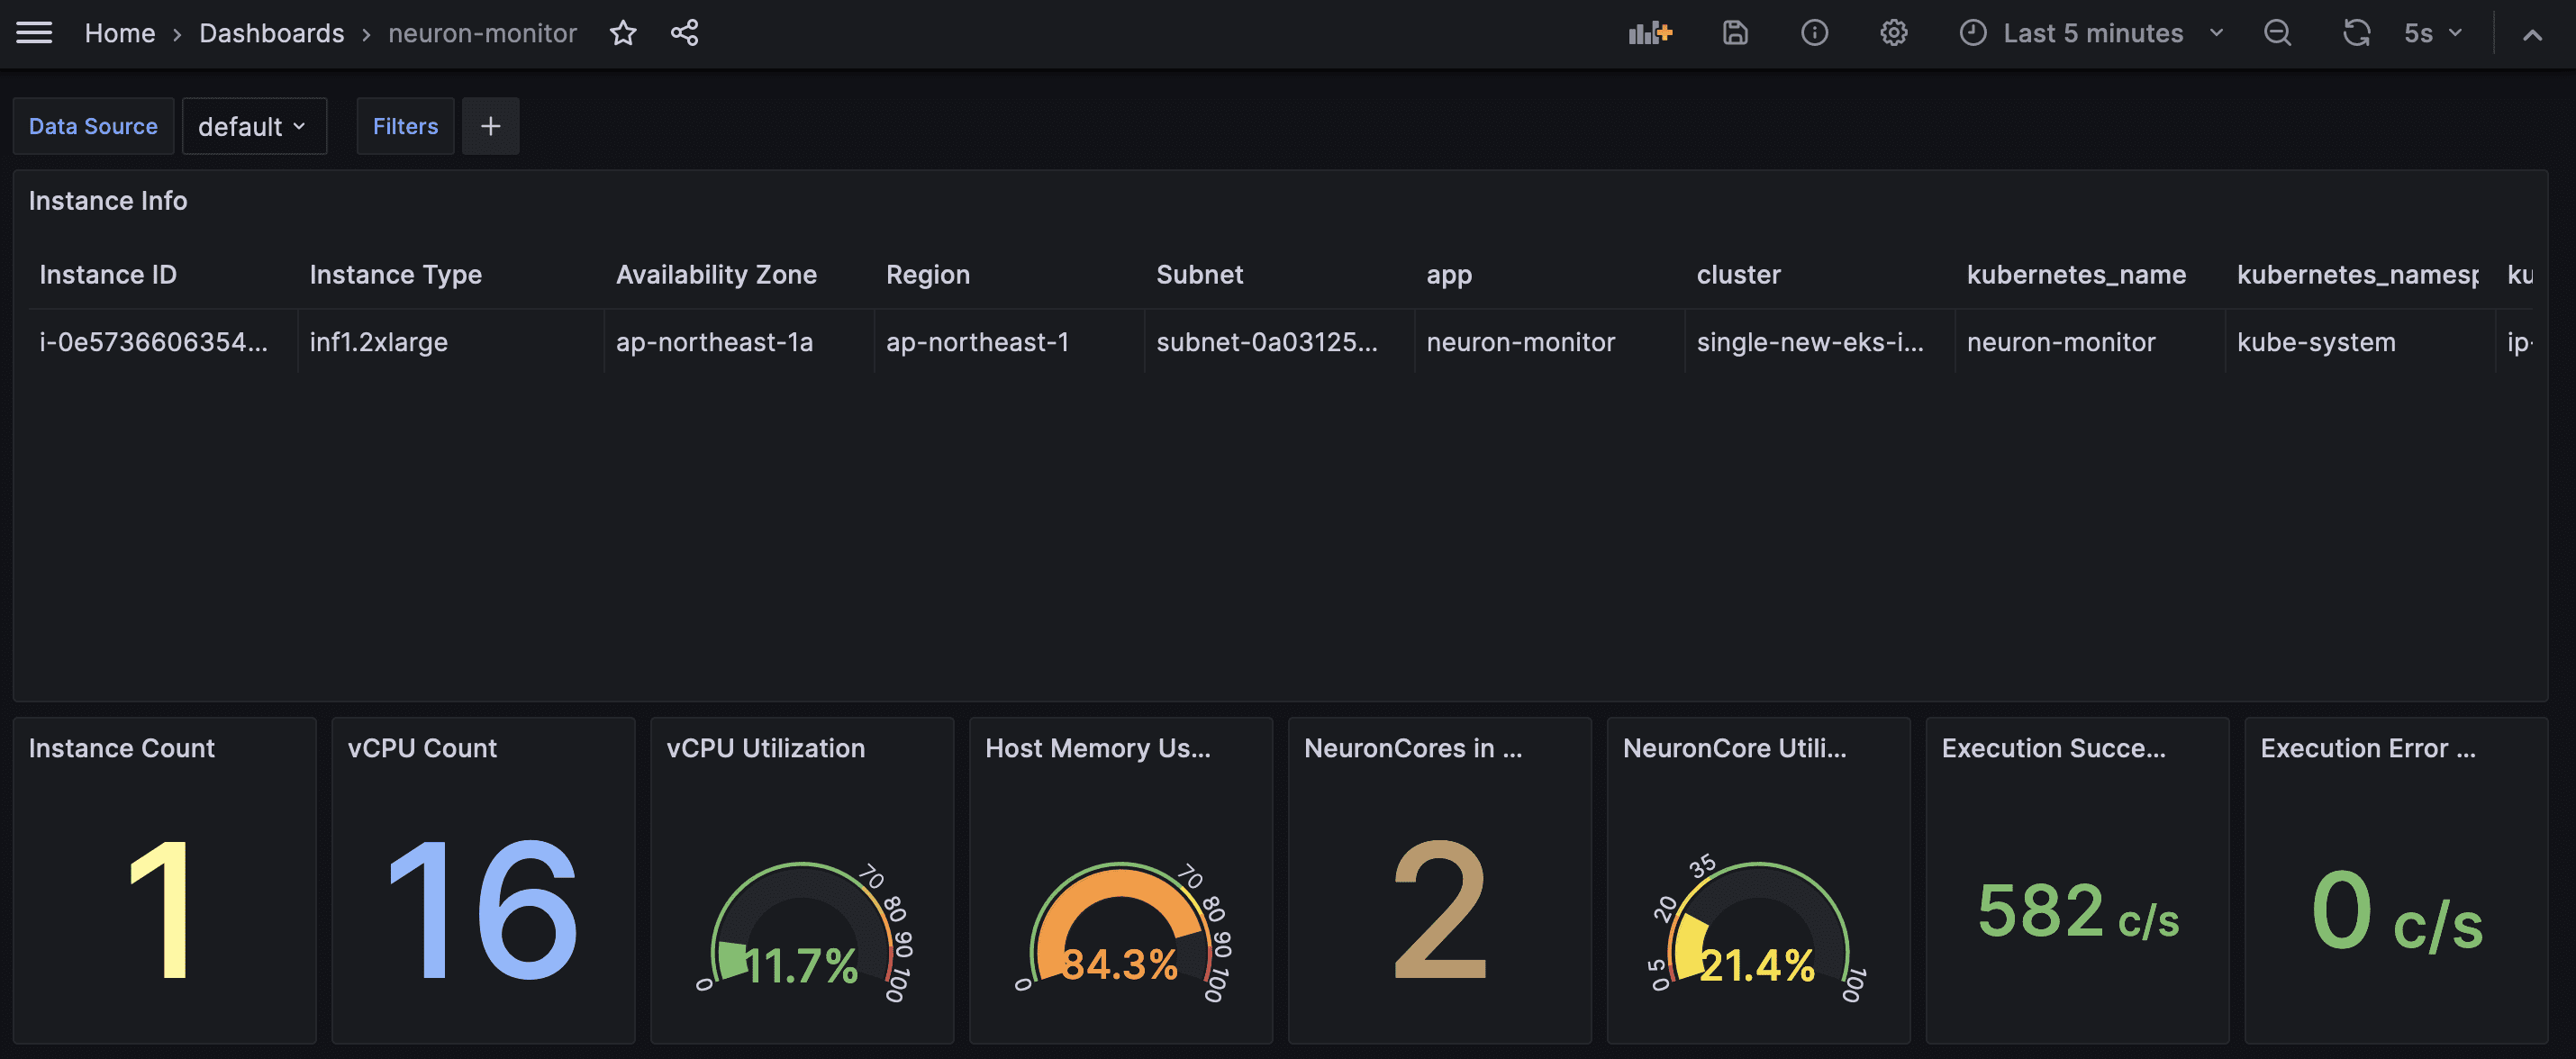
Log in to your Amazon Managed Grafana workspace and navigate to the Dashboards panel. You should see a dashboard named Neuron / Monitor.
To see some interesting metrics on the Grafana dashboard, we apply the following manifest:
This is a sample workload that compiles the torchvision ResNet50 model and runs repetitive inference in a loop to generate telemetry data.
To verify the pod was successfully deployed, run the following code:
You should see a pod named pytorch-inference-resnet50.
After a few minutes, looking into the Neuron / Monitor dashboard, you should see the gathered metrics similar to the following screenshots.


Grafana Operator and Flux always work together to synchronize your dashboards with Git. If you delete your dashboards by accident, they will be re-provisioned automatically.
Clean up
You can delete the whole AWS CDK stack with the following command:
Conclusion
In this post, we showed you how to introduce observability, with open source tooling, into an EKS cluster featuring a data plane running EC2 Inf1 instances. We started by selecting the Amazon EKS-optimized accelerated AMI for the data plane nodes, which includes the Neuron container runtime, providing access to AWS Inferentia and Trainium Neuron devices. Then, to expose the Neuron cores and devices to Kubernetes, we deployed the Neuron device plugin. The actual collection and mapping of telemetry data into Prometheus-compatible format was achieved via neuron-monitor and neuron-monitor-prometheus.py. Metrics were sourced from Amazon Managed Service for Prometheus and displayed on the Neuron dashboard of Amazon Managed Grafana.
We recommend that you explore additional observability patterns in the AWS Observability Accelerator for CDK GitHub repo. To learn more about Neuron, refer to the AWS Neuron Documentation.
About the Author
 Riccardo Freschi is a Sr. Solutions Architect at AWS, focusing on application modernization. He works closely with partners and customers to help them transform their IT landscapes in their journey to the AWS Cloud by refactoring existing applications and building new ones.

Leave a Reply