Governing the ML lifecycle at scale: Centralized observability with Amazon SageMaker and Amazon CloudWatch
This post is part of an ongoing series on governing the machine learning (ML) lifecycle at scale. To start from the beginning, refer to Governing the ML lifecycle at scale, Part 1: A framework for architecting ML workloads using Amazon SageMaker.
A multi-account strategy is essential not only for improving governance but also for enhancing security and control over the resources that support your organization’s business. This approach enables various teams within your organization to experiment, innovate, and integrate more rapidly while keeping the production environment secure and available for your customers. However, because multiple teams might use your ML platform in the cloud, monitoring large ML workloads across a scaling multi-account environment presents challenges in setting up and monitoring telemetry data that is scattered across multiple accounts. In this post, we dive into setting up observability in a multi-account environment with Amazon SageMaker.
Amazon SageMaker Model Monitor allows you to automatically monitor ML models in production, and alerts you when data and model quality issues appear. SageMaker Model Monitor emits per-feature metrics to Amazon CloudWatch, which you can use to set up dashboards and alerts. You can use cross-account observability in CloudWatch to search, analyze, and correlate cross-account telemetry data stored in CloudWatch such as metrics, logs, and traces from one centralized account. You can now set up a central observability AWS account and connect your other accounts as sources. Then you can search, audit, and analyze logs across your applications to drill down into operational issues in a matter of seconds. You can discover and visualize operational and model metrics from many accounts in a single place and create alarms that evaluate metrics belonging to other accounts.
AWS CloudTrail is also essential for maintaining security and compliance in your AWS environment by providing a comprehensive log of all API calls and actions taken across your AWS account, enabling you to track changes, monitor user activities, and detect suspicious behavior. This post also dives into how you can centralize CloudTrail logging so that you have visibility into user activities within all of your SageMaker environments.
Solution overview
Customers often struggle with monitoring their ML workloads across multiple AWS accounts, because each account manages its own metrics, resulting in data silos and limited visibility. ML models across different accounts need real-time monitoring for performance and drift detection, with key metrics like accuracy, CPU utilization, and AUC scores tracked to maintain model reliability.
To solve this, we implement a solution that uses SageMaker Model Monitor and CloudWatch cross-account observability. This approach enables centralized monitoring and governance, allowing your ML team to gain comprehensive insights into logs and performance metrics across all accounts. With this unified view, your team can effectively monitor and manage their ML workloads, improving operational efficiency.
Implementing the solution consists of the following steps:
- Deploy the model and set up SageMaker Model Monitor.
- Enable CloudWatch cross-account observability.
- Consolidate metrics across source accounts and build unified dashboards.
- Configure centralized logging to API calls across multiple accounts using CloudTrail.
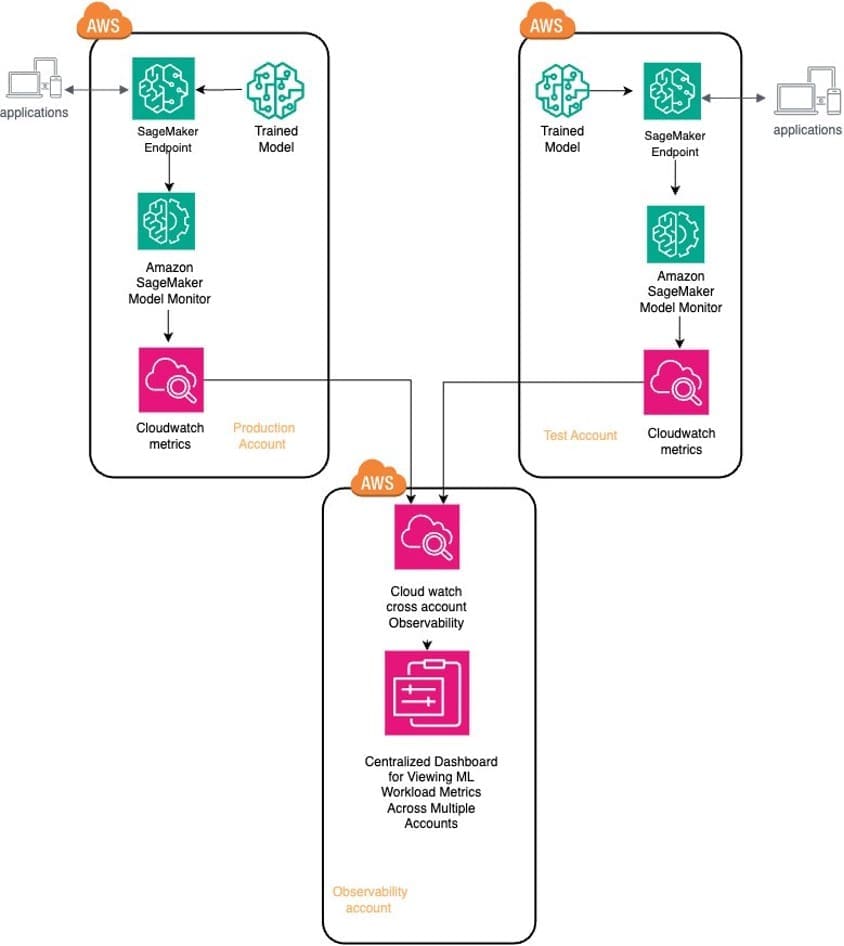
The following architecture diagram showcases the centralized observability solution in a multi-account setup. We deploy ML models across two AWS environments, production and test, which serve as our source accounts. We use SageMaker Model Monitor to assess these models’ performance. Additionally, we enhance centralized management and oversight by using cross-account observability in CloudWatch to aggregate metrics from the ML workloads in these source accounts into the observability account.
Deploy the model and set up SageMaker Model Monitor
We deploy an XGBoost classifier model, trained on publicly available banking marketing data, to identify potential customers likely to subscribe to term deposits. This model is deployed in both production and test source accounts, where its real-time performance is continually validated against baseline metrics using SageMaker Model Monitor to detect deviations in model performance. Additionally, we use CloudWatch to centralize and share the data and performance metrics of these ML workloads in the observability account, providing a comprehensive view across different accounts. You can find the full source code for this post in the accompanying GitHub repo.
The first step is to deploy the model to an SageMaker endpoint with data capture enabled:
endpoint_name = f"BankMarketingTarget-endpoint-{datetime.utcnow():%Y-%m-%d-%H%M}"
print("EndpointName =", endpoint_name)

data_capture_config = DataCaptureConfig(
enable_capture=True, sampling_percentage=100, destination_s3_uri=s3_capture_upload_path)

model.deploy(
initial_instance_count=1,
instance_type="ml.m4.xlarge",
endpoint_name=endpoint_name,
data_capture_config=data_capture_config,)
For real-time model performance evaluation, it’s essential to establish a baseline. This baseline is created by invoking the endpoint with validation data. We use SageMaker Model Monitor to perform baseline analysis, compute performance metrics, and propose quality constraints for effective real-time performance evaluation.
Next, we define the model quality monitoring object and run the model quality monitoring baseline job. The model monitor automatically generates baseline statistics and constraints based on the provided validation data. The monitoring job evaluates the model’s predictions against ground truth labels to make sure the model maintains its performance over time.
In addition to the generated baseline, SageMaker Model Monitor requires two additional inputs: predictions from the deployed model endpoint and ground truth data provided by the model-consuming application. Because data capture is enabled on the endpoint, we first generate traffic to make sure prediction data is captured. When listing the data capture files stored, you should expect to see various files from different time periods, organized based on the hour in which the invocation occurred. When viewing the contents of a single file, you will notice the following details. The inferenceId attribute is set as part of the invoke_endpoint call. When ingesting ground truth labels and merging them with predictions for performance metrics, SageMaker Model Monitor uses inferenceId, which is included in captured data records. It’s used to merge these captured records with ground truth records, making sure the inferenceId in both datasets matches. If inferenceId is absent, it uses the eventId from captured data to correlate with the ground truth record.
SageMaker Model Monitor ingests ground truth data collected periodically and merges it with prediction data to calculate performance metrics. This monitoring process uses baseline constraints from the initial setup to continuously assess the model’s performance. By enabling enable_cloudwatch_metrics=True, SageMaker Model Monitor uses CloudWatch to monitor the quality and performance of our ML models, thereby emitting these performance metrics to CloudWatch for comprehensive tracking.
Each time the model quality monitoring job runs, it begins with a merge job that combines two datasets: the inference data captured at the endpoint and the ground truth data provided by the application. This is followed by a monitoring job that assesses the data for insights into model performance using the baseline setup.
Check for deviations from the baseline constraints to effectively set appropriate thresholds in your monitoring process. As you can see in the following the screenshot, various metrics such as AUC, accuracy, recall, and F2 score are closely monitored, each subject to specific threshold checks like LessThanThreshold or GreaterThanThreshold. By actively monitoring these metrics, you can detect significant deviations and make informed decisions promptly, making sure your ML models perform optimally within established parameters.
Enable CloudWatch cross-account observability
With CloudWatch integrated into SageMaker Model Monitor to track the metrics of ML workloads running in the source accounts (production and test), the next step involves enabling CloudWatch cross-account observability. CloudWatch cross-account observability allows you to monitor and troubleshoot applications spanning multiple AWS accounts within an AWS Region. This feature enables seamless searching, visualization, and analysis of metrics, logs, traces, and Application Insights across linked accounts, eliminating account boundaries. You can use this feature to consolidate CloudWatch metrics from these source accounts into the observability account.
To achieve this centralized governance and monitoring, we establish two types of accounts:
- Observability account – This central AWS account aggregates and interacts with ML workload metrics from the source accounts
- Source accounts (production and test) – These individual AWS accounts share their ML workload metrics and logging resources with the central observability account, enabling centralized oversight and analysis
Configure the observability account
Complete the following steps to configure the observability account:
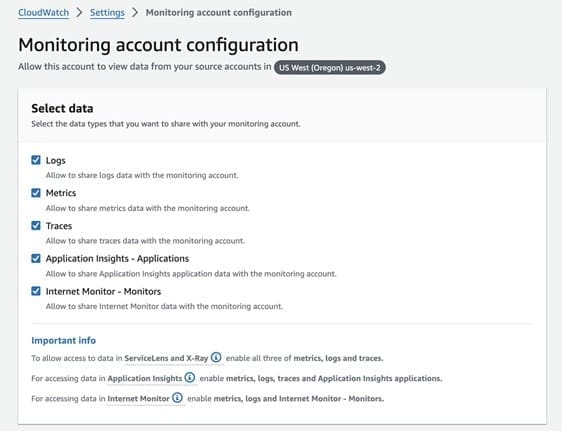
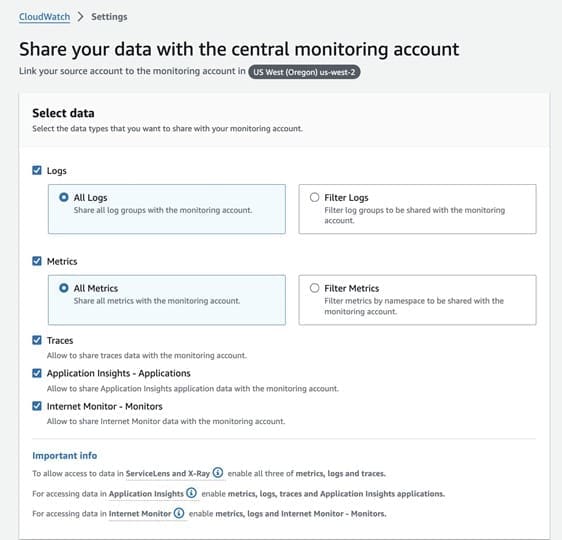
- On the CloudWatch console of the observability account, choose Settings in the navigation pane.
- In the Monitoring account configuration section, choose Configure.
- Select which telemetry data can be shared with the observability account.
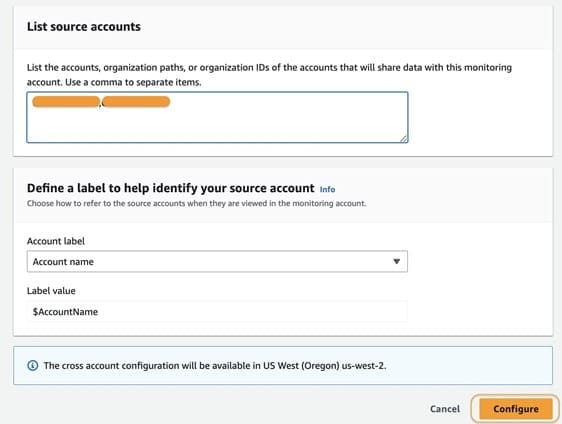
- Under List source accounts, enter the source accounts that will share data with the observability account.
To link the source accounts, you can use account IDs, organization IDs, or organization paths. You can use an organization ID to include all accounts within the organization, or an organization path can target all accounts within a specific department or business unit. In this case, because we have two source accounts to link, we enter the account IDs of those two accounts.
- Choose Configure.
After the setup is complete, the message “Monitoring account enabled” appears in the CloudWatch settings.
Additionally, your source accounts are listed on the Configuration policy tab.
Link source accounts
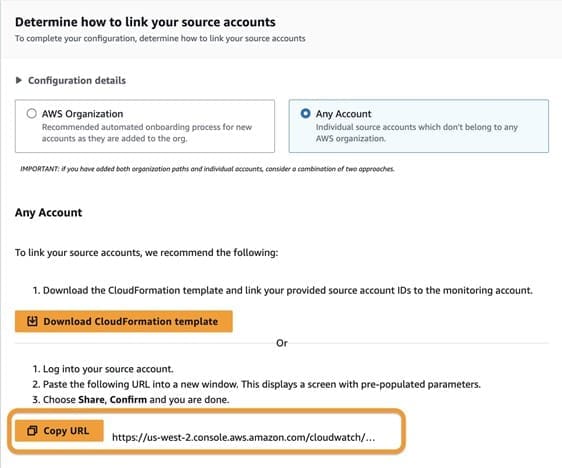
Now that the observability account has been enabled with source accounts, you can link these source accounts within an AWS organization. You can choose from two methods:
- For organizations using AWS CloudFormation, you can download a CloudFormation template and deploy it in a CloudFormation delegated administration account. This method facilitates the bulk addition of source accounts.
- For linking individual accounts, two options are available:
- Download a CloudFormation template that can be deployed directly within each source account.
- Copy a provided URL, which simplifies the setup process using the AWS Management Console.
Complete the following steps to use the provided URL:
- Copy the URL and open it in a new browser window where you’re logged in as the source account.
- Configure the telemetry data you want to share. This can include logs, metrics, traces, Application Insights, or Internet Monitor.
During this process, you’ll notice that the Amazon Resource Name (ARN) of the observability account configuration is automatically filled in. This convenience is due to copying and pasting the URL provided in the earlier step. If, however, you choose not to use the URL, you can manually enter the ARN. Copy the ARN from the observability account settings and enter it into the designated field in the source account configuration page.
- Define the label that identifies your source accounts. This label is crucial for organizing and distinguishing your accounts within the monitoring system.
- Choose Link to finalize the connection between your source accounts and the observability account.
- Repeat these steps for both source accounts.
You should see those accounts listed on the Linked source accounts tab within the observability account CloudWatch settings configuration.
Consolidate metrics across source accounts and build unified dashboards
In the observability account, you can access and monitor detailed metrics related to your ML workloads and endpoints deployed across the source accounts. This centralized view allows you to track a variety of metrics, including those from SageMaker endpoints and processing jobs, all within a single interface.
The following screenshot displays CloudWatch model metrics for endpoints in your source accounts. Because you linked the production and test source accounts using the label as the account name, CloudWatch categorizes metrics by account label, effectively distinguishing between the production and test environments. It organizes key details into columns, including account labels, metric names, endpoints, and performance metrics like accuracy and AUC, all captured by scheduled monitoring jobs. These metrics offer valuable insights into the performance of your models across these environments.
The observability account allows you to monitor key metrics of ML workloads and endpoints. The following screenshots display CPU utilization metrics associated with the BankMarketingTarget model and BankMarketing model endpoints you deployed in the source accounts. This view provides detailed insights into critical performance indicators, including:
- CPU utilization
- Memory utilization
- Disk utilization
Furthermore, you can create dashboards that offer a consolidated view of key metrics related to your ML workloads running across the linked source accounts. These centralized dashboards are pivotal for overseeing the performance, reliability, and quality of your ML models on a large scale.
Let’s look at a consolidated view of the ML workload metrics running in our production and test source accounts. This dashboard provides us with immediate access to critical information:
- AUC scores – Indicating model performance, giving insights into the trade-off between true positives and false positives
- Accuracy rates – Showing prediction correctness, which helps in assessing the overall reliability of the model
- F2 scores – Offering a balance between precision and recall, particularly valuable when false negatives are more critical to minimize
- Total number of violations – Highlighting any breaches in predefined thresholds or constraints, making sure the model adheres to expected behavior
- CPU usage levels – Helping you manage resource allocation by monitoring the processing power utilized by the ML workloads
- Disk utilization percentages – Providing efficient storage management by keeping track of how much disk space is being consumed
This following screenshots show CloudWatch dashboards for the models deployed in our production and test source accounts. We track metrics for accuracy, AUC, CPU and disk utilization, and violation counts, providing insights into model performance and resource usage.
You can configure CloudWatch alarms to proactively monitor and receive notifications on critical ML workload metrics from your source accounts. The following screenshot shows an alarm configured to track the accuracy of our bank marketing prediction model in the production account. This alarm is set to trigger if the model’s accuracy falls below a specified threshold, so any significant degradation in performance is promptly detected and addressed. By using such alarms, you can maintain high standards of model performance and quickly respond to potential issues within your ML infrastructure.
You can also create a comprehensive CloudWatch dashboard for monitoring various aspects of Amazon SageMaker Studio, including the number of domains, apps, and user profiles across different AWS accounts. The following screenshot illustrates a dashboard that centralizes key metrics from the production and test source accounts.
Configure centralized logging of API calls across multiple accounts with CloudTrail
If AWS Control Tower has been configured to automatically create an organization-wide trail, each account will send a copy of its CloudTrail event trail to a centralized Amazon Simple Storage Service (Amazon S3) bucket. This bucket is typically created in the log archive account and is configured with limited access, where it serves as a single source of truth for security personnel. If you want to set up a separate account to allow the ML admin team to have access, you can configure replication from the log archive account. You can create the destination bucket in the observability account.
After you create the bucket for replicated logs, you can configure Amazon S3 replication by defining the source and destination bucket, and attaching the required AWS Identity and Access Management (IAM) permissions. Then you update the destination bucket policy to allow replication.
Complete the following steps:
- Create an S3 bucket in the observability account.
- Log in to the log archive account.
- On the Amazon S3 console, open the Control Tower logs bucket, which will have the
format aws-controltower-logs-{ACCOUNT-ID}-{REGION}.
You should see an existing key that corresponds to your organization ID. The trail logs are stored under /{ORG-ID}/AWSLogs/{ACCOUNT-ID}/CloudTrail/{REGION}/YYYY/MM/DD.
- On the Management tab, choose Create replication rule.
- For Replication rule name, enter a name, such as
replicate-ml-workloads-to-observability. - Under Source bucket, select Limit the scope of the rule using one or more filters, and enter a path the corresponds to the account you want to enable querying against.
- Select Specify a bucket in another account and enter the observability account ID and the bucket name.
- Select Change object ownership to destination bucket owner.
- For IAM role, choose Create new role.
After you set the cross-account replication, the logs being stored in the S3 bucket in the log archive account will be replicated in the observability account. You can now use Amazon Athena to query and analyze the data being stored in Amazon S3. If you don’t have Control Tower configured, you have to manually configure CloudTrail in each account to write to the S3 bucket in the centralized observability account for analysis. If your organization has more stringent security and compliance requirements, you can configure replication of just the SageMaker logs from the log archive account to the bucket in the observability account by integrating Amazon S3 Event Notifications with AWS Lambda functions.
The following is a sample query run against the logs stored in the observability account bucket and the associated result in Athena:
SELECT useridentity.arn, useridentity.sessioncontext.sourceidentity, requestparametersFROM observability_replicated_logs
WHERE eventname = 'CreateEndpoint'
AND eventsource = 'sagemaker.amazonaws.com'
Conclusion
Centralized observability in a multi-account setup empowers organizations to manage ML workloads at scale. By integrating SageMaker Model Monitor with cross-account observability in CloudWatch, you can build a robust framework for real-time monitoring and governance across multiple environments.
This architecture not only provides continuous oversight of model performance, but also significantly enhances your ability to quickly identify and resolve potential issues, thereby improving governance and security throughout our ML ecosystem.
In this post, we outlined the essential steps for implementing centralized observability within your AWS environment, from setting up SageMaker Model Monitor to using cross-account features in CloudWatch. We also demonstrated centralizing CloudTrail logs by replicating them from the log archive account and querying them using Athena to get insights into user activity within SageMaker environments across the organization.
As you implement this solution, remember that achieving optimal observability is an ongoing process. Continually refining and expanding your monitoring capabilities is crucial to making sure your ML models remain reliable, efficient, and aligned with business objectives. As ML practices evolve, blending cutting-edge technology with sound governance principles is key. Run the code yourself using the following notebook or try out the observability module in the following workshop.
About the Authors
 Abhishek Doppalapudi is a Solutions Architect at Amazon Web Services (AWS), where he assists startups in building and scaling their products using AWS services. Currently, he is focused on helping AWS customers adopt Generative AI solutions. In his free time, Abhishek enjoys playing soccer, watching Premier League matches, and reading.
 Venu Kanamatareddy is a Startup Solutions Architect at AWS. He brings 16 years of extensive IT experience working with both Fortune 100 companies and startups. Currently, Venu is helping guide and assist Machine Learning and Artificial Intelligence-based startups to innovate, scale, and succeed.
 Vivek Gangasani is a Senior GenAI Specialist Solutions Architect at AWS. He helps emerging GenAI companies build innovative solutions using AWS services and accelerated compute. Currently, he is focused on developing strategies for fine-tuning and optimizing the inference performance of Large Language Models. In his free time, Vivek enjoys hiking, watching movies and trying different cuisines.
 Ram Vittal is a Principal ML Solutions Architect at AWS. He has over 3 decades of experience architecting and building distributed, hybrid, and cloud applications. He is passionate about building secure, scalable, reliable AI/ML and big data solutions to help enterprise customers with their cloud adoption and optimization journey to improve their business outcomes. In his spare time, he rides motorcycle and walks with his three-year old sheep-a-doodle!






Leave a Reply