Amazon Forecast now supports the generation of forecasts at a quantile of your choice
We are happy to announce that Amazon Forecast can now generate forecasts at a quantile of your choice.
Launched at re:Invent 2018, and generally available since Aug 2019, Forecast is a fully managed service that uses machine learning (ML) to generate highly accurate forecasts, without requiring any prior ML experience. Forecast is applicable in a wide variety of use cases, including estimating product demand, supply chain optimization, energy demand forecasting, financial planning, workforce planning, computing cloud infrastructure usage, and traffic demand forecasting.
Based on the same technology used at Amazon.com, Forecast is a fully managed service, so there are no servers to provision. Additionally, you only pay for what you use, and there are no minimum fees or upfront commitments. To use Forecast, you only need to provide historical data for what you want to forecast, and optionally any additional data that you believe may impact your forecasts. The latter may include both time-varying data such as price, events, and weather, and categorical data such as color, genre, or region. The service automatically trains and deploys ML models based on your data, and provides you a custom API from which to download forecasts.
Unlike most other forecasting solutions that generate point forecasts (p50), Forecast generates probabilistic forecasts at three default quantiles: 10% (p10), 50% (p50), and 90% (p90). You can choose the forecast that suits your business needs depending on the trade-off between the cost of capital (over-forecasting) or missing customer demand (under-forecasting) in your business. For the p10 forecast, the true value is expected to be lower than the predicted value 10% of the time. If the cost of invested capital is high (for example, being overstocked with product), the p10 quantile forecast is useful to order relatively fewer items. Similarly, with the p90 forecast, the true value is expected to be lower than the predicted value 90% of the time. If missing customer demand would result in either a significant amount of lost revenue or a poor customer experience, the p90 forecast is more useful. For more information, see Evaluating Predictor Accuracy.
While the three existing quantiles supported by Forecast are useful, they can also be limiting for two reasons. Firstly, the fixed quantiles may not always meet specific use case requirements. For example, if meeting customer demand is imperative at all costs, a p99 forecast may be more useful than p90.
Secondly, because Forecast always generates forecasts at three different quantiles by default, you are billed for three quantiles, even if only one quantile is relevant for your decision making processes. Forecast now allows you to override the default quantiles, and choose up to five quantiles of your choice (any quantile between 1% and 99%, including mean). You can achieve this by passing an optional parameter in the CreateForecast API or specifying the override quantiles directly in the AWS Management Console. You can continue to query your forecasts via the console or the QueryForecast API.
This post looks at how to use this new feature via the console. You can also access this feature via the CreateForecast API.
To demonstrate this functionality, we use the same example from the earlier blog post Amazon Forecast – Now Generally Available. The example uses the individual household electric power consumption dataset from the UCI Machine Learning Repository. For more information about creating a predictor in Forecast, see the preceding post.
Once the predictor is active, go to the console to generate forecasts or use the CreateForecast API. On the Create a forecast page, there is a new optional parameter called Forecast types, where you can override the default quantiles of .10, .50, and .90.
For this post, we add the custom quantiles of .10, .35, mean, .75, and .99.
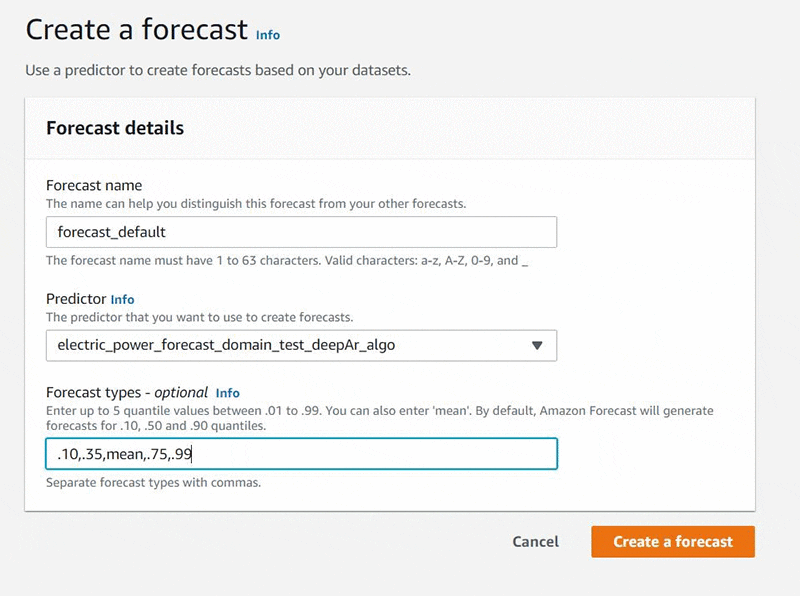
Accepted values include any value between .01 to .99 (in increments of .01), including the mean. The mean forecast is different from the median (.50) when the distribution is not symmetric (for example, Beta and Negative Binomial). In this case, because you specified five quantiles, you are billed for all five. For example, if you generated forecasts for 5,000 time series, you are billed for 25,000 unique forecasts. Because the service bills in units of 1,000, this results in a total bill of 25 x $0.60 = $15. For more information on the latest pricing plan, see Amazon Forecast Pricing.
When the forecast is active, you can query and visualize the forecast using the Forecast lookup tool from the console.
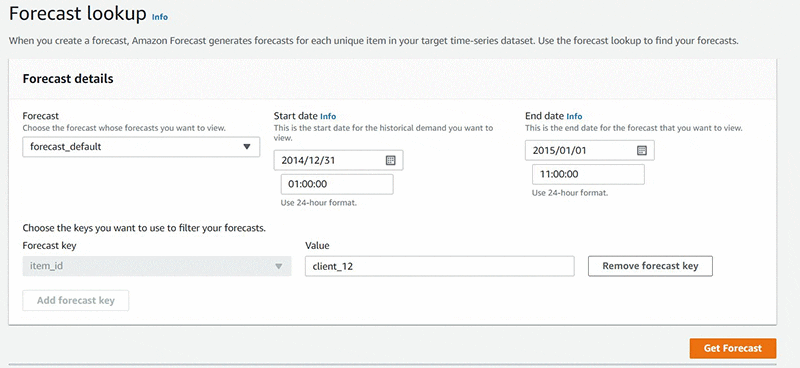
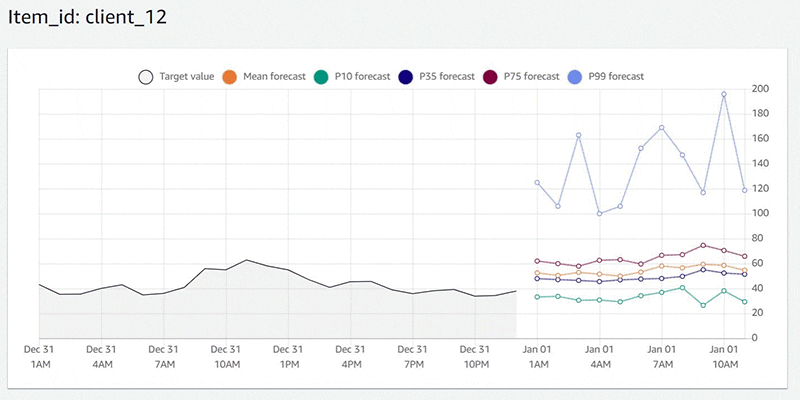
The following graph shows the historical demand and forecasts for a specific time series, in this case “client_12”. All the quantiles specified during CreateForecast (in this case, .10, .35, mean, .75, and .99) are displayed here.
In addition to querying a forecast in the console, you can also export forecasts as a .csv file in an Amazon S3 bucket of your choice. The exported .csv file contains the forecasts for all your time series and the quantiles selected. In our specific example, this is the energy demand forecasts for each client, for the five quantiles chosen. To export your forecast, you can use the CreateForecastExportJob API or via the “Create forecast export” button in the console, as displayed in the screenshot below.

Once you click ‘Create forecast export’, you are taken to the detail page below. Here you specify the name for your export job, specify the forecast, IAM role and the S3 bucket where you want the file to be stored.
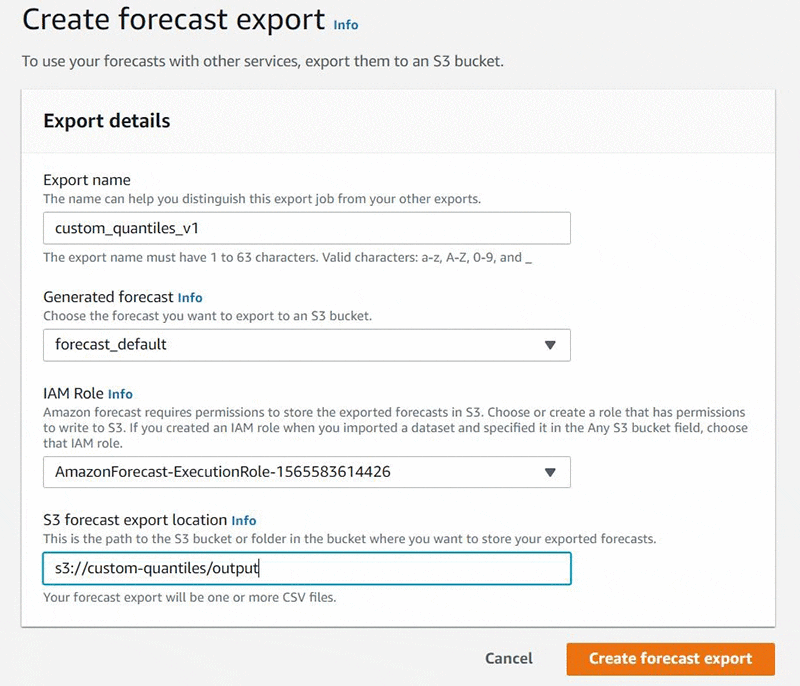
When the export job is complete, you can navigate to S3 (via the console) and verify that the file has been created in the relevant S3 bucket.
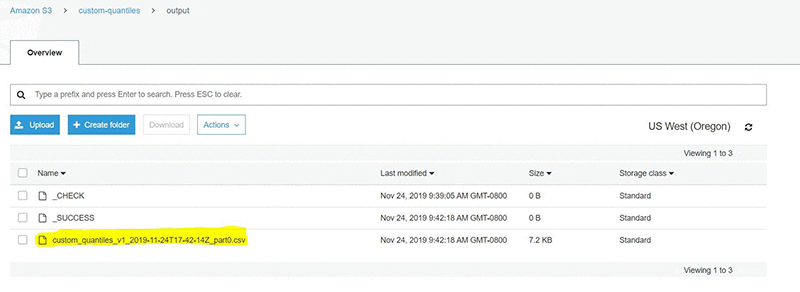
The following table shows the content of the csv, corresponding to the generated forecasts for each client for all quantiles specified over the entire forecast horizon.
|
item_id |
date | p10 | p35 | mean | p75 |
p99 |
| client_111 | 2015-01-01T01:00:00Z | 48.89389038 | 69.03968811 | 75.33065033 | 88.43639374 | 174.2510834 |
| client_111 | 2015-01-01T02:00:00Z | 49.26203156 | 67.66025543 | 72.34096527 | 85.50863647 | 148.0922241 |
| client_111 | 2015-01-01T03:00:00Z | 46.06879807 | 67.83860016 | 76.61499786 | 83.54689789 | 225.3299561 |
| client_111 | 2015-01-01T04:00:00Z | 45.66434097 | 65.45301056 | 73.38169098 | 88.51142883 | 138.77005 |
| client_111 | 2015-01-01T05:00:00Z | 43.5483017 | 66.55085754 | 70.6720047 | 88.17260742 | 144.4982605 |
| client_111 | 2015-01-01T06:00:00Z | 50.08174133 | 67.60101318 | 75.05982971 | 83.4147644 | 206.5582886 |
| client_111 | 2015-01-01T07:00:00Z | 50.79389954 | 66.47422791 | 78.7857666 | 90.23943329 | 222.6696167 |
| client_111 | 2015-01-01T08:00:00Z | 58.11802673 | 67.99427795 | 76.23995209 | 88.22603607 | 185.4029236 |
| client_111 | 2015-01-01T09:00:00Z | 42.96152878 | 74.78701019 | 80.14347839 | 96.66455841 | 142.397644 |
| client_111 | 2015-01-01T10:00:00Z | 59.34168243 | 72.34555054 | 80.24354553 | 94.45916748 | 164.3058929 |
| client_111 | 2015-01-01T11:00:00Z | 53.01160049 | 72.67097473 | 79.31721497 | 90.48171234 | 208.0553894 |
| client_111 | 2015-01-01T12:00:00Z | 47.87768173 | 69.18990326 | 77.85028076 | 89.63658905 | 143.6833801 |
| client_111 | 2015-01-01T13:00:00Z | 46.98330688 | 71.60288239 | 86.48907471 | 87.89906311 | 1185.726318 |
Summary
You can now use Forecast to generate probabilistic forecasts at any quantile of your choice. This allows you to build forecasts that are specific to your use case, and reduce your bills by choosing and paying for precisely the quantiles you need. You can start using this feature today in all Regions in which Forecast is available. Please share feedback either via the AWS forum or your regular AWS Support channels.
About the author
 Rohit Menon is a senior product manager for Amazon Forecast at AWS.
 Ammar Chinoy is a senior software development manager for Amazon Forecast at AWS.
Tags: Archive

Leave a Reply