Automating your Amazon Forecast workflow with Lambda, Step Functions, and CloudWatch Events rule
Amazon Forecast is a fully managed service that uses machine learning (ML) to generate highly accurate forecasts without requiring any prior ML experience. Forecast is applicable in a wide variety of use cases, including estimating product demand, energy demand, workforce planning, computing cloud infrastructure usage, traffic demand, supply chain optimization, and financial planning.
Forecast is a fully managed service, so there are no servers to provision or ML models to build manually. Additionally, you only pay for what you use, and there is no minimum fee or upfront commitment. To use Forecast, you only need to provide historical data for what you want to forecast, and optionally any additional related data that you believe may influence your forecasts. The latter may include both time-varying data, such as price, events, and weather, and categorical data, such as color, genre, or region. The service automatically trains and deploys ML models based on your data and provides you a custom API to retrieve forecasts.
This post discusses the system architecture for Amazon Redshift to use Forecast to manage hardware and help customers spin up Amazon Redshift clusters quickly. This system architecture is use case agnostic; you can reference it in multiple scenarios. To learn more about how to use Amazon Forecast, see Amazon Forecast – Now Generally Available and Amazon Forecast now supports the generation of forecasts at a quantile of your choice.
Use case background
Amazon Redshift is a fully managed, petabyte- or even exabyte-scale data warehouse service in the cloud. An Amazon Redshift cluster is composed of one or more nodes. To set up a cluster as fast as we can to provide superior customer experience, we maintain cache pools to hold a certain number of nodes with preinstalled database software commonly referred to as a warm pool. Whenever a customer requests for a new cluster, Amazon Redshift grabs the required number of nodes from the cache pools. Amazon Redshift records every request and each entry contains the following attributes: Location, Timestamp, and NumberOfNodes. The following table presents example data.
| LocationId | Timestamp | NumberOfNodes |
| A | 2019-01-01T18:05:00Z | 5 |
| A | 2019-01-01T18:20:00Z | 7 |
| A | 2019-01-01T18:52:06Z | 11 |
| A | 2019-01-01T19:06:00Z | 9 |
| B | 2019-01-01T19:31:40Z | 9 |
Accurately predicting demand to maintain the right number of nodes in the cache pool is critical to quickly meeting demand while minimizing operational costs. Maintaining less capacity in the pool causes slow cluster delivery and results in sub-optimal customer experience. On the other hand, maintaining excessive inventory of nodes in the cache pool incurs high operational costs. Amazon Redshift uses Forecast to predict the demand for nodes at any given time. Compared to the percentile-based predictor that Amazon Redshift used prior to Forecast, warm pool capacity utilization has improved by 70%.
Overall system architecture
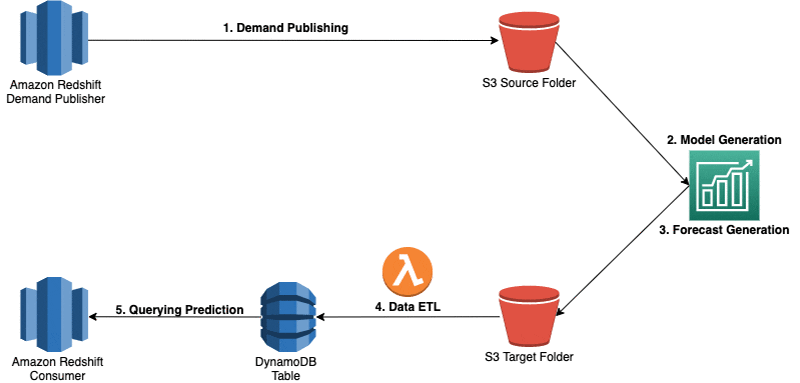
The following diagram provides an overview of the system architecture that Amazon Redshift has implemented to automate node demand prediction using Forecast. The architecture contains the following steps:
- Publish demand using AWS Lambda, AWS Step Functions, and Amazon CloudWatch Events rule to periodically (hourly) query the database and write the past X-months (count from the current timestamp) demand data into the source Amazon S3
- Generate model using Lambda, Step Functions, and CloudWatch Events rule to call Forecast APIs to create and update the model.
- Generate forecasts using Lambda, Step Functions, and CloudWatch Events rule to periodically (hourly) call Forecast APIs and export the predictions into the target S3 bucket.
- Load data using an S3 event trigger and a Lambda function into an Amazon DynamoDB table, whenever there is a new file with predictions in the target S3 bucket or folder.
- Query DynamoDB directly to determine future demand
Setting up a predictor using Forecast
The following sections discuss how to select parameters when you use the Forecast service APIs to create the necessary resources. For more information, see Amazon Forecast – Now Generally Available.
Creating the dataset
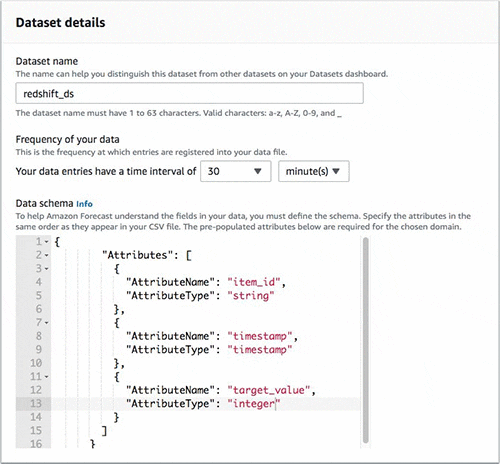
After we create the dataset group, we create a time series dataset and add it to the dataset group. When creating a dataset, we specify the metadata for the time series, such as schema and data frequency. The following screenshot shows the schema, where the item_id is the warm pool ID, and the target_value is the number of nodes for each request. The preparation duration for the host determines the data frequency (i.e. the time between calling an Amazon EC2 RunInstance API and when the instance becomes available to serve as a cluster node). We track this duration by using CloudWatch metrics. Finally, we proceed to use the dataset import job to copy our data from S3 to Forecast.
Creating the prediction
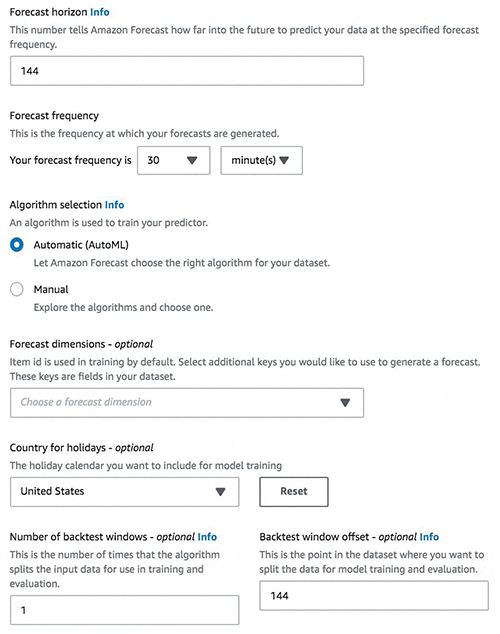
The next step is to create the predictor, which is the ML model. Specify the forecast horizon, which is the number of time-steps the model is trained to predict. This post chooses 144 time-steps, where each time-step is 30 mins (matching the data frequency), which essentially generates forecasts three days into the future. In the following screenshot, we use AutoML to allow Forecast to pick the most accurate model for the data. Finally, we generate the Forecast using the Create Forecast API.
Automating forecast generation at a predefined cadence
You can create a model and use it to generate forecasts at a specific cadence. In most cases, it is unlikely for the data patterns to change substantially over short periods of time. Hence, it is optimal to train a model one time and use it to generate forecasts whenever new data becomes available, and have a separate job or workflow to retrain the model at a cadence at which you expect the data patterns to change. This section lays out the steps to automate your forecast model training and forecast generation workflows using Forecast.
Incorporating system redundancy
You first need to define the look-back period, which specifies the start time and end time for your historical demand data, and the prediction period, which is the duration in the future you want to predict for. This post uses the past 100 hours as the look-back period and 4 hours as the prediction period. We upload the data within this look-back period, for example, between now-100h and now (marked in yellow in the following graph) and let the service process it to generate results between now to now+4h (marked in green in the following graph). The following graph shows one cycle of the automated prediction process.

We repeat this process one hour later by moving forward both the look-back period and the prediction period by one hour.
The following screenshot shows the updated prediction period.

To have redundancy in production, we create a new forecast every hour (even though our forecast horizon is four hours). There might always be unexpected errors or outages from dependent services. If we let Forecast predict for a longer horizon, we can still use the last generated forecast until the underlying issue is fixed. The new forecast should override the forecast for the overlapping time intervals between two hourly runs.
Automating the forecast workflow
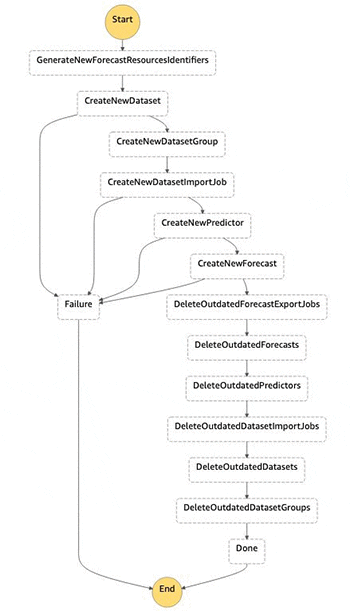
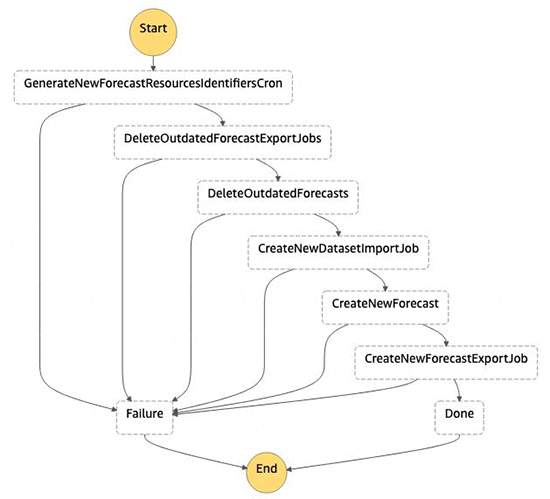
To automate the forecast workflow, we create two cron (time-based job scheduler) jobs. The first to retrain the model periodically and the second to import updated data and generate inferences using the existing model.
The following screenshot shows the first cron job for periodically retraining a model. Because the historical demand does not have a trend that changes often, we do not need to retrain our model often. For our use case, we run it once every 30 days. This cadence might vary depending on your specific use case. If there is a change in the data patterns, the AutoML functionality within Forecast picks this up and suggests the most optimal algorithm when we re-train the model.
The second cron job in the following figure periodically imports new data and the existing model to create a new forecast and associated export job. Forecast uses the updated demand data to generate forecasts for the new horizon. We make this cron job run hourly. Because the publisher keeps replacing the same file name with the new demand data, we keep the S3 Input File Path the same.
Sample code
You can download the sample code from the GitHub repo.
Summary
This post discussed how Amazon Redshift uses Forecast, including the underlying system architecture and how to automate forecast generation using Forecast (along with sample code), for the common scenario of creating a model one time and using it to generate forecasts multiple times. This solution is applicable across multiple use cases and makes your path to automating your forecast workflow easier. Please share feedback about this post either on the AWS forum or through your regular AWS Support channels.
About the authors
 Zhixing Ma is a senior software development engineer on the Amazon Redshift team where he led the Amazon Redshift inventory management project. Being the first internal customer with Amazon Forecast, his team interacted closely with service team scientists, product managers, and engineers to build a reliable and scalable auto prediction system.
 Srinivas Chakravarthi Thandu is a software development engineer on the Amazon Redshift team and his focus areas includes machine learning and data analytics. The range of projects he dealt in Redshift includes cost optimization and infrastructure management related which involves ml modeling and applied computing. He had the opportunity to work closely with the research and engineering teams at Amazon Forecast while the service was taking shape.
 Vivek Ramamoorthy is a Software Development Manager on AWS Redshift and currently leads the team that is responsible for Cluster Management and Infrastructure. In his spare time, he enjoys watching movies and experimenting with building software for IoT devices.
 Yuyang (Bernie) Wang is a Senior Machine Learning Scientist in Amazon AI Labs, working mainly on large-scale probabilistic machine learning with its application in Forecasting. His research interests span statistical machine learning, numerical linear algebra, and random matrix theory. In forecasting, Yuyang has worked on all aspects ranging from practical applications to theoretical foundations.
 Rohit Menon is a Sr. Product Manager currently leading product for Amazon Forecast at AWS. His current focus is to democratize time series forecasting by using machine learning. In his spare time, he enjoys reading and watching documentaries.
Tags: Archive

Leave a Reply