Making accurate energy consumption predictions with Amazon Forecast
Amazon Forecast is a fully managed service that uses machine learning (ML) to generate highly accurate forecasts, without requiring any prior ML experience. Forecast is applicable in a wide variety of use cases, including energy demand forecasting, estimating product demand, workforce planning, and computing cloud infrastructure usage.for m
With Forecast, there are no servers to provision or ML models to build manually. Additionally, you only pay for what you use, and there is no minimum fee or upfront commitment. To use Forecast, you only need to provide historical data for what you want to forecast, and, optionally, any additional data that you believe may impact your forecasts. This related data may include both time-varying data, such as price, events, and weather, and categorical data, such as color, genre, or region. The service automatically trains and deploys ML models based on your data and provides you with a custom API to retrieve forecasts.
Power and utility providers have several forecasting use cases, but primary among them is predicting energy consumption both at the customer and aggregate level. Predicting energy consumption accurately is critical so customers do not face any service interruptions and to provide a stable grid system while maintaining low prices.
This post explores using Forecast to address this use case by combining historical time series data with critical exogenous variables such as weather.
Use case background
Accurate energy forecasting is critical to make sure that utilities can run day-to-day operations efficiently. Energy forecasting is particularly challenging because demand is dynamic, and seasonal weather changes can have an impact. The following are the two most common use cases:
- Power consumption forecast at a consumer level – In many countries, power is provided in competitive retail markets. Consumers have a choice in buying electricity and can switch providers if they receive high energy bills or have a bad customer experience. As a utility provider, you can reduce customer churn by improving customer service and proactively reaching out with future bill spend alerts. These alerts are based on accurately predicting electricity consumption at an individual customer level.
- Power consumption forecast at an aggregate level to better manage supply and demand – As a utility provider, you must balance aggregate supply and demand. You often have to purchase energy to meet peak demand or sell excess capacity in the spot market. Moreover, demand forecasting has become more challenging with the following:
- The introduction of renewable energy resources, such as wind and solar. These are owned both by utilities and end consumers, are subject to weather changes, and do not produce stable power at all times.
- The rise of electric vehicle purchases and the unknown nature of when vehicle owners want to charge them at home. Improved forecasting enables you to plan ahead to structure more cost-effective futures contracts.
This post focuses on a solution for the first use case, at the consumer level.
The first step is to set up and prepare your data. Data lakes have proven to be revolutionary for utilities. A data warehouse is a repository for structured and filtered data that has already been processed for a specific purpose. In contrast, a data lake is a storage repository that holds a vast amount of raw data in its native format until needed. This is very valuable for a power or utility company that collects, stores, and processes meter readings from millions of customers.
Solution architecture
The following diagram illustrates the architecture of a solution you can implement to surface bill alerts to your customers.
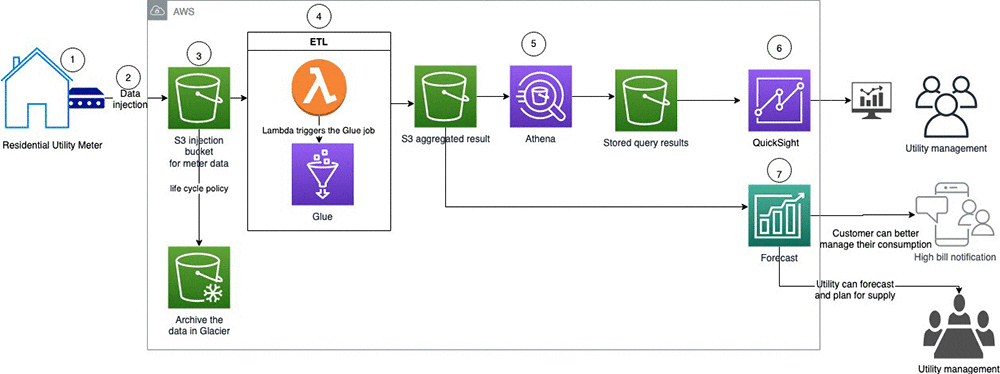
The architecture contains the following steps:
- Utility meters in residential homes typically record energy hourly or more frequently and report at least daily to the utility company.
- You can implement data ingestion via various channels. If you collect the data in an on-premises data center, you can send the data to AWS via AWS Direct Connect. If the meters have IoT capability, you can send the data to AWS IoT Core via an MQTT topic. MQTT is a machine-to-machine (M2M)/IoT connectivity protocol. It was designed as an extremely lightweight publish and subscribe messaging transport. It is useful for connections in remote locations that require a small code footprint or in which network bandwidth is at a premium.
- You use Amazon S3 to store the raw meter data The Amazon S3-based data lake solution uses Amazon S3 as its primary storage platform. Amazon S3 provides an optimal foundation for a data lake because of its unlimited scalability. You can increase storage from gigabytes to petabytes seamlessly and pay only for what you use. Amazon S3 is designed to provide 99.999999999% durability. You can put a lifecycle policy in place to archive the data into Amazon S3 Glacier, which is more cost-effective. For more information, see Building Big Data Storage Solutions (Data Lakes) for Maximum Flexibility.
- Ingested data lands in an S3 bucket called the raw zone. When the data is available, an Amazon S3 trigger invokes an AWS Lambda function, which processes and moves the data into another S3 bucket called the processed zone.
- You can query the data in Amazon S3 via Amazon Athena. Athena is an interactive query service that makes it easy to analyze data directly in Amazon S3 using standard SQL. Athena automatically stores query results and metadata information for each query that runs in a query result location, which you can specify in Amazon S3.
- You can access the query result bucket with Amazon QuickSight. Amazon QuickSight is a business analytics service you can use to build visualizations, perform ad hoc analysis, and get business insights from your data. It can automatically discover AWS data sources and also works with your data sources.
- You can use the processed data from Amazon S3 to make predictions with Forecast. Residential customers can use these results to see future energy consumption, which allows them to calculate energy costs and move to a more efficient pricing plan or modify future usage as needed. You can use the Query API and integrate it with your mobile or web application to provide your customers visibility into future demand and help drive consumption. For more information about automating your Forecast-related workflows, see Automating your Amazon Forecast workflow with Lambda, Step Functions, and CloudWatch Events rule.
Setting up Forecast
This post evaluates two different approaches to forecasting energy consumption at the individual customer level, one without related time series information and another with related time series data.
In forecasting problems, related time series are variables (such as weather or price) that correlate with the target value and lend statistical strength to a forecast on the target value (for this post, energy demand). More precisely, Forecast treats related time series as exogenous variables. These variables are not a part of the model specification, but you can use them to capture the correlation between the current value of the related time series with the corresponding value of the target time series.
You might not always improve accuracy by incorporating related time series. Therefore, you have to base any addition of related time series on backtesting to check if the overall accuracy is either improved or unchanged with the addition of the same. Forecast doesn’t require a related time series, but it does require target time series. If a related time series has missing values or other quality issues, it might be better to not include the same to avoid introducing noises to the model. Essentially, to decide which related time series is useful or how to use them effectively is a key feature engineering task.
For more information, see Using Related Time Series Datasets.
Creating an energy consumption forecast model with ARIMA
Autoregressive integrated moving average (ARIMA) is a classic statistical model for time series. It uses past values to explain the future by expressing the time series values with a linear combination of its lagged values and forecast errors. You can use ARIMA with an autoregressive integrated moving average with explanatory variable (ARIMAX) model, or without related time series or regression variables. When you apply ARIMA models, it can be difficult to choose the proper model order, which is a manual and subjective process. In Forecast, you use auto.arima to automatically find the ARIMA model that best suited for the data.
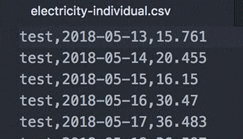
The input data used is individual energy consumption data. It is a CSV file with three attributes:
The following screenshot shows an example of a customer data snapshot.
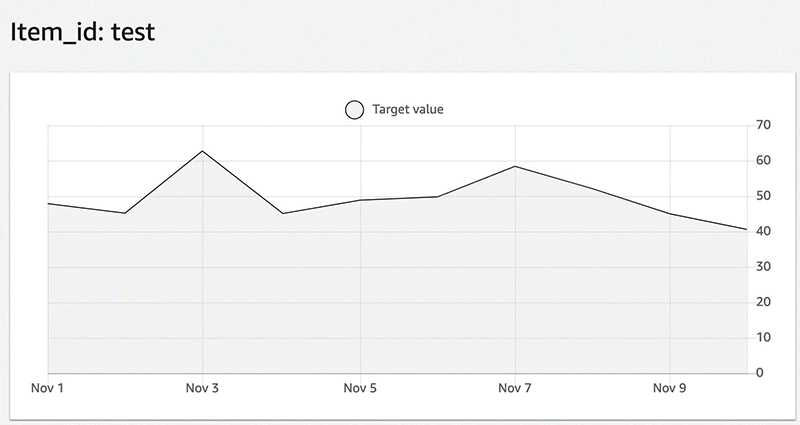
The following graph is a visualization of that example data.
For more information about creating resources, see Amazon Forecast – Now Generally Available. The key steps are as follows:
- On the Amazon Forecast console, choose Create dataset group.
- Provide a name and a forecasting domain.
- Specify the target time series dataset:
Item_idis the utilitytimestampis the dateTarget_valueis the energy consumed.
- Create an import job to import historical data. Make sure that the IAM role has access to the S3 bucket where the CSV file is uploaded.
- After you import the data, the status of the target time series data shows as active.
- On the Dashboard, under Train a predictor, choose Start.
- For the algorithm, this post uses ARIMA.
- When the predictor training is complete, the status on the dashboard shows as active.
- Create the forecast.
After you successfully create the forecast, you can query it for a specific customer ID or run an export job to generate the results for all customer IDs. The following screenshot shows the forecast energy consumption for the ID test.
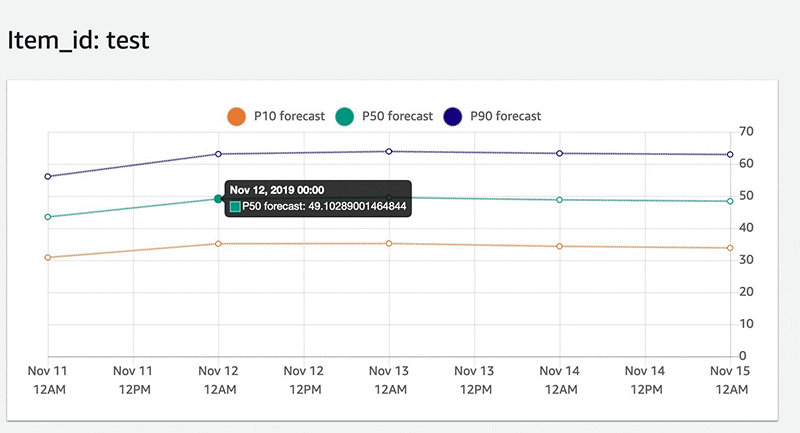
Although this walkthrough didn’t include factors like temperature, this is an excellent way to get started and establish a baseline model with the target time series data. Also, as a utility trying to meet aggregate supply and demand, you can potentially aggregate all the customer data and predict future consumption to plan supply accordingly.
Creating an energy consumption forecast model with DeepAR+
The Forecast DeepAR+ algorithm is a supervised learning algorithm for forecasting scalar (one-dimensional) time series using recurrent neural networks (RNNs). Classic forecasting methods, such as ARIMA or exponential smoothing (ETS), fit a single model to each individual time series. In contrast, DeepAR+ creates a global model (one model for all the time series) with the potential benefit of learning across time series.
The DeepAR+ model is particularly useful when working with a large collection (over thousands) of target time series, in which certain time series have a limited amount of information. For example, to forecast the energy consumption of each household, global models such as DeepAR+ could use the statistical strengths of the more informative ones to better predict new households. Additionally, DeepAR+ can account for related time series, which can help improve your forecast.
This use case adds weather data, given its correlation to energy consumption. The key steps are as follows:
- Update the dataset group with related time series data by creating a new dataset import job.This model considered the following fields (apart from
timestampandCustomerID):dayofweekdailyaveragedrybulbtemperaturedailycoolingdegreedaysdailydeparturefromnormalaveragetemperaturedailyaveragenormaltempdailyheatingdegreedaysdailymaximumdrybulbtemperaturedailyminimumdrybulbtemperaturelength_of_day_hours
The following table summarizes this data for Seattle (given that the customers in this dataset reside in that city) from a public weather source.
dayofweek dailyaveragedrybulbtemperature dailycoolingdegreedays dailydeparturefromnormalaveragetemperature dailyaveragenormaltemp dailyheatingdegreedays dailymaximumdrybulbtemperature dailyminimumdrybulbtemperature Length_of_Day_Hours 7 53 0 -3.1 56.1 12 60 46 15.03 1 55 0 -1.3 56.3 10 60 49 15.08 2 51 0 -5.5 56.5 14 55 47 15.12 3 50 0 -6.7 56.7 15 53 46 15.15 4 53 0 -3.9 56.9 12 60 46 15.2 5 57 0 -0.1 57.1 8 64 50 15.25 6 62 0 4.7 57.3 3 73 50 15.28 7 64 0 6.5 57.5 1 72 56 15.32 1 64 0 6.3 57.7 1 76 51 15.35 2 69 4 11.1 57.9 0 82 55 15.4 3 67 2 8.9 58.1 0 81 53 15.43 - Create a new predictor with the updated dataset.
- Generate a new model.
- Create a new forecast.
The following screenshot shows the forecast energy consumption for the same test customer ID using the new model.
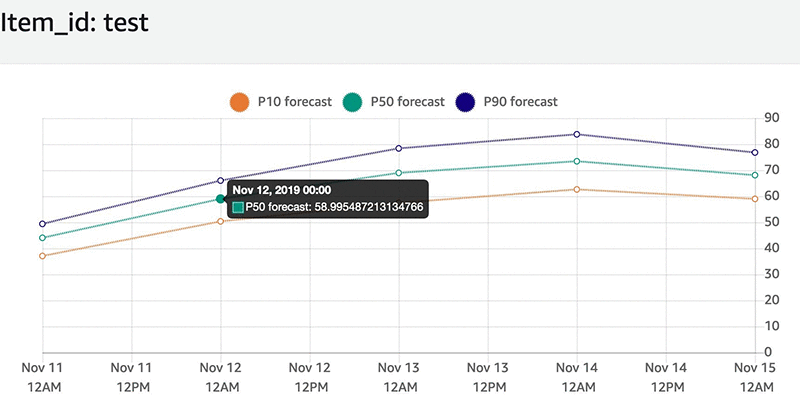
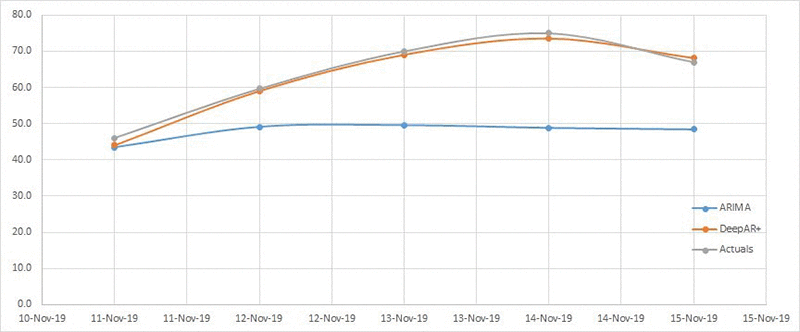
You can evaluate the results from the two models (ARIMA and DeepAR+ with related time series) with the actual energy consumption over a forecast horizon of 5 days (for this post, November 11, 2019, to November 15, 2019).
To make this evaluation, use the wQL[0.5]/MAPE metric. The calculated MAPE metric with ARIMA is 0.25, whereas the DeepAR+ model with weather data included has a MAPE of 0.04. You can learn more about evaluating your model here. The DeepAR+ model with weather helped improve model accuracy by 84%. The following table summarizes the details in this comparison.
| Date | ARIMA (in kWh) | DeepAR+ (in kWh) | Actual energy consumption (in kWh) |
| 11/11/2019 | 43.5 | 44.1 | 46 |
| 11/12/2019 | 49.1 | 59 | 59.6 |
| 11/13/2019 | 49.5 | 69 | 70 |
| 11/14/2019 | 48.8 | 73.5 | 75 |
| 11/15/2019 | 48.4 | 68.1 | 67 |
The following graph visualizes the compared data.
Summary
This post discussed how to use Forecast and its underlying system architecture to predict individual customer energy demand using smart meter data. You can enhance model accuracy with DeepAR+ and weather data to achieve a forecast accuracy of approximately 96% (as determined by MAPE).
About the Authors
 Neelam Koshiya is an enterprise solution architect at AWS. Her current focus is to help enterprise customers with their cloud adoption journey for strategic business outcomes. In her spare time, she enjoys reading and being outdoors.
 Rohit Menon is a Sr. Product Manager currently leading product for Amazon Forecast at AWS. His current focus is to democratize time series forecasting by using machine learning. In his spare time, he enjoys reading and watching documentaries.
 Yuyang (Bernie) Wang is a Senior Machine Learning Scientist in Amazon AI Labs, working mainly on large-scale probabilistic machine learning with its application in Forecasting. His research interests span statistical machine learning, numerical linear algebra, and random matrix theory. In forecasting, Yuyang has worked on all aspects ranging from practical applications to theoretical foundations.
Tags: Archive

Leave a Reply