Building a lawn monitor and weed detection solution with AWS machine learning and IoT services
For new home buyers, a common challenge is to understand how to manage their lawn needs effectively. Now imagine if you’re a farmer and have to do this for many acres of land. As a farmer, some of the challenges you’d typically face include the when (when is the right time to water), the where (where exactly to water or add fertilizer), and the how (how to handle weeds). In a research study conducted by the Weed Science Society of America (WSSA), combined losses in corn and soybean crops due to uncontrolled weeds would total $43 billion annually. For more information, see WSSA Calculates Billions in Potential Economic Losses from Uncontrolled Weeds on the WSSA website.
What if you could use technology and the latest advancements in the field of computer vision and machine learning (ML) to solve this problem?
This is a complex problem to solve, and many enterprises are working on a solution. This post covers how to get started and build a solution using an AWS Starter Kit. The solution has two components:
- Weed detection using image classification and AWS DeepLens
- Near real-time monitoring of lawn conditions (soil moisture level, fertility level, and sunlight) using AWS IoT
Prerequisites
To implement this solution, you must have the following prerequisites:
- AWS DeepLens
- Raspberry Pi
- Soil moisture sensors (this post uses four FlowerCare from Xiaomi sensors)
Detecting weeds using image classification
As herbicide resistance is becoming more and more common, weed control is gaining greater importance in agricultural domains. It’s important to detect weeds and take preventive actions early to enhance farm productivity. This is now possible with AWS DeepLens. AWS DeepLens is the world’s first deep learning enabled video camera for developers. With AWS DeepLens, you can get started in minutes with a fully programmable video camera, tutorials, code, and pre-trained models designed to expand deep learning skills. It also lets you learn and explore the latest artificial intelligence (AI) tools and technology for developing computer vision applications based on a deep learning model.
With AWS DeepLens, you can classify images as weeds or grass in real time. You can also connect AWS DeepLens to a microcontroller to trigger a spray to kill the weeds.
This post demonstrates how to detect weeds using the image classification algorithm in Amazon SageMaker. Amazon SageMaker is a fully managed ML service. With Amazon SageMaker, you can quickly and easily build and train ML models, and directly deploy them into a production-ready hosted environment. It provides an integrated Jupyter notebook for easy access to your data sources for exploration and analysis, so you don’t have to manage servers. This post demonstrates how to train a model in the fully managed and on-demand training infrastructure of Amazon SageMaker. In addition, it also demonstrates how to deploy the trained model on AWS DeepLens.
The following architecture diagram gives a high-level overview of the weed detection solution:
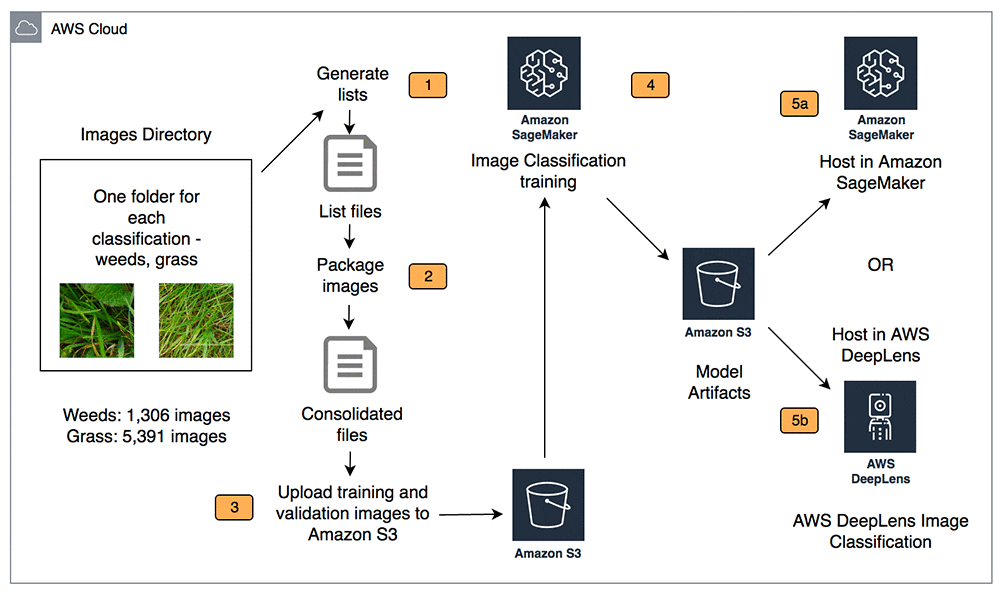
This solution uses the image classification algorithm in Amazon SageMaker in transfer learning mode to fine-tune a pre-trained model (trained on ImageNet data) to classify a new dataset. Transfer learning allows you to train deep networks with significantly less data than if you had to train a model from scratch. With transfer learning, you are essentially transferring the knowledge that a model has learned from a previous task to your current task. The idea is that the two tasks are not disjointed, and you can use whatever network parameters that model has learned through its extensive training without having to do that training yourself.
The architecture includes the following steps:
- Download the dataset of your images consisting of weeds and grass to your local computer. Organize the images into two distinct folders on your local computer.
- Create two .lst files using the RecordIO tool
im2rec. One file is for the training portion of the dataset (80%). The other is for testing (20%). For more information, see Create a Dataset Using RecordIO on the MXNet website. - Generate both
.recfiles from the.lstfiles and copy both.recfiles (training and validation images) to an Amazon S3 - Train your model using the Amazon SageMaker image classification algorithm in transfer learning mode.
- After you train the model, the training job uploads model artifacts to your S3 buckets. Alternatively, deploy your trained model on AWS DeepLens for real-time inferencing at the edge.
The following sections describe the detailed implementation of the solution.
Understanding the dataset
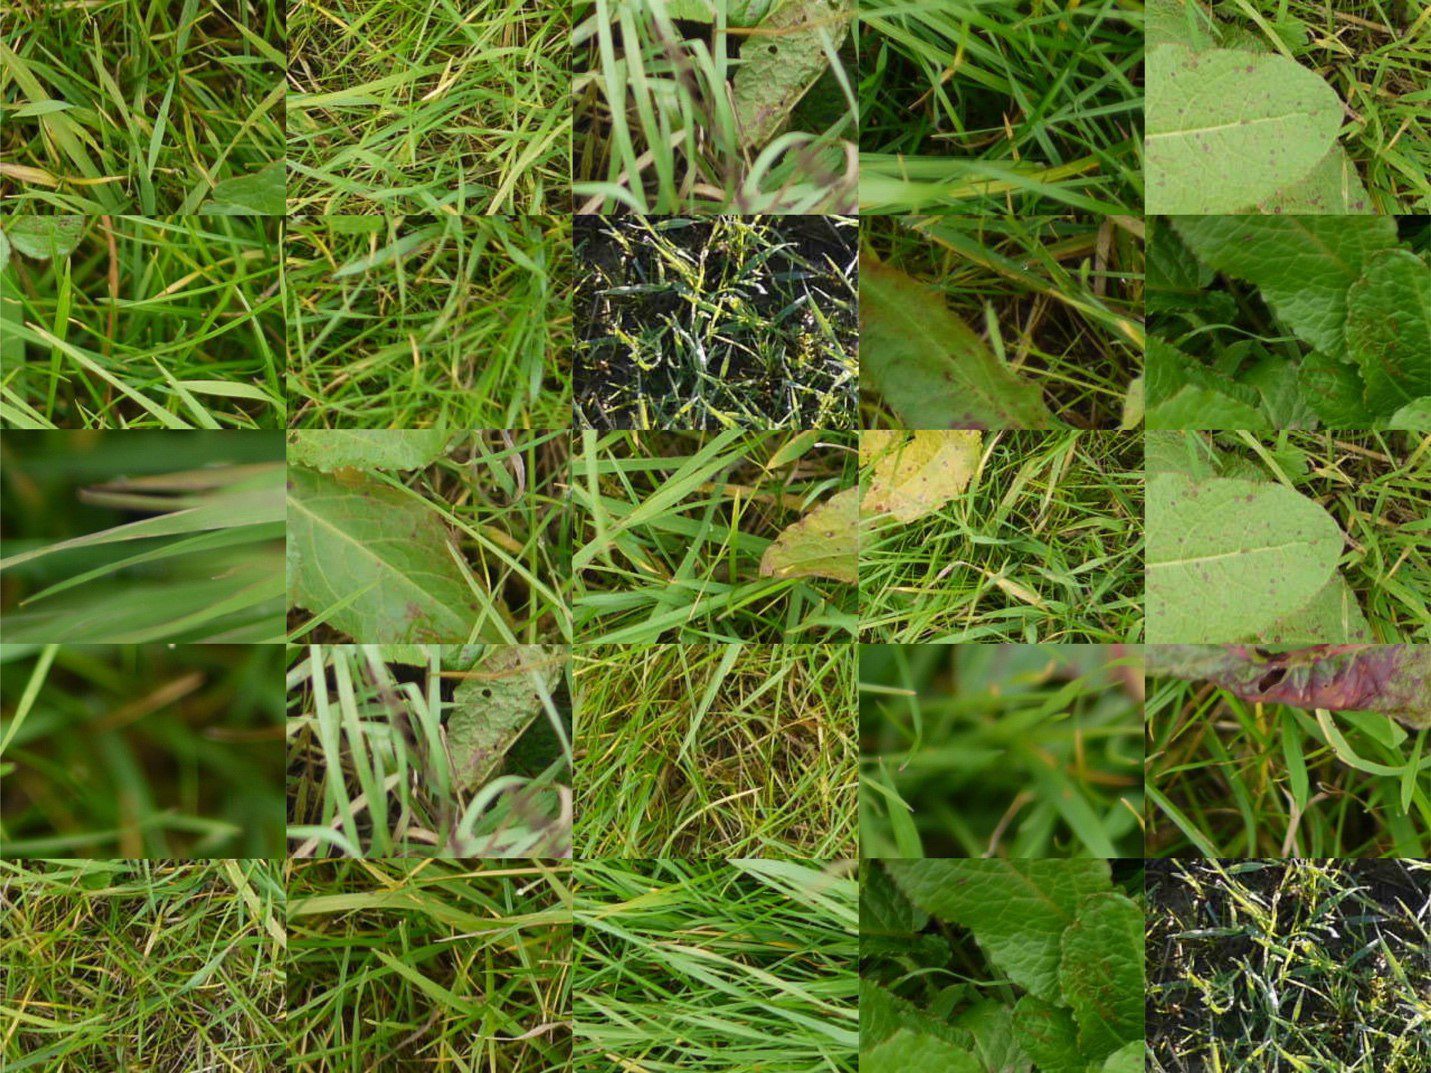
The Open Sprayer images dataset on the Kaggle website includes pictures of broad-leaved docks (weeds) and pictures of the land without broad-leaved docks (grass). The dataset comes with 1,306 images of weeds and 5,391 images of grass, with a typical size of about 256 pixels by 256 pixels. The dataset provides a recommended train/validate split. The following image shows a collection of weed and grass images.
Preparing the image dataset
This post demonstrates how to use the RecordIO file format for image classification using pipe mode. In pipe mode, your training job streams data directly from Amazon S3. With pipe mode, you reduce the size of the Amazon EBS volumes for your training instances. For more information, see Using pipe input mode for Amazon SageMaker algorithms. You can use the image classification algorithm with either file or pipe input modes. Even though pipe mode is recommended for large datasets, file mode is still useful for small files that fit in memory and where the algorithm has a large number of epochs.
MXNet provides a tool called im2rec to create RecordIO files for your datasets. To use the tool, you provide listing files that describe the set of images. For more information about im2rec, see the im2rec GitHub repo.
To prepare your image dataset, complete the following steps using a local Python interpreter or through a Jupyter notebook on Amazon SageMaker. You execute these steps from the path where you’ve stored your image dataset.
- Generate listing files using
im2rec.py. See the following code: - Use the
im2recutility to create the RecordIO files by entering the following code:im2rectakes the following parameters:
-
- list – im2rec creates an image list by traversing root folder and output to
.lst. - recursive – Recursively walks through subdirectories and assigns a unique label to images in each folder.
- train-ratio – Ratio of images to use for training.
- test-ratio – Ratio of images to use for testing.
- num-thread – Number of threads to use for encoding. The greater this value, the faster the processing.
- resize – Resize the shorter edge of an image to the new size; original images are packed by default.
- quality – JPEG quality for encoding, 1–100; or PNG compression for encoding, 1–9 (default: 95).
- list – im2rec creates an image list by traversing root folder and output to
For more information, see MXNet made simple: Image RecordIO with im2rec and Data Loading.
Implementing the code
To demonstrate each step of the solution, this post uses the Jupyter notebook from the GitHub repo.
Setting up your S3 bucket
Create an S3 bucket to upload the training and validation files in the RecordIO format as well as model artifacts. Use the default_bucket() session parameter from the SageMaker Python SDK. For instructions on creating an S3 bucket manually, see Creating a bucket.
The RecordIO files serve as an input to the image classification algorithm. The training data should be inside a subdirectory called train and validation data should be inside a subdirectory called validation:
For more information, see the GitHub repo.
Training the image classification model using the Amazon SageMaker built-in algorithm
With the images available in Amazon S3, you are ready to train the model. This post has a few hyperparameters of interest:
- Number of classes and training samples
- Batch size, epochs, image size, and pre-trained model
For more information, see Image Classification Hyperparameters.
The Amazon SageMaker image classification algorithm requires you to train models on a GPU instance type, such as ml.p2.xlarge. Set the hyperparameters to the following values:
num_layers = 18. Number of layers (depth) for the network. This post uses 18, but you can use other values, such as 50 and 152.image_shape = 3,224,224. Input image dimensions,num_channels, height, and width for the network. It should be no larger than the actual image size. The number of channels should be the same as the actual image. This post uses image dimensions of 3, 224, 224, which is similar to the ImageNet dataset.num_training_samples = 4520. Number of training examples in the input dataset.num_classes = 2. Number of output classes for the new dataset. This post uses 2 because there are two object categories: weeds and grass.mini_batch_size = 128. Number of training samples used for each mini-batch.epochs = 10. Number of training epochs.learning_rate =001. Learning rate for training.top_k = 2. Reports the top-k accuracy during training. This parameter has to be greater than 1 because the top-1 training accuracy is the same as the regular training accuracy that has already been reported.use_pretrained_model = 1. Set to1to use a pre-trained model for transfer learning.
After you upload the dataset to Amazon S3 and set the hyperparameters, you can start the training with the Amazon SageMaker CreateTrainingJob API. Because you’re using the RecordIO format for training, you specify both train and validation channels as values for the InputDataConfig parameter of the CreateTrainingJob request. You specify one RecordIO (.rec) file in the train channel and one RecordIO file in the validation channel. Set the content type for both channels to application/x-recordio. See the following code:
When the training job is complete, you should see the following message:
The output model is stored in the output path specified by training_params['OutputDataConfig']:
For the full code for model training, see the GitHub repo.
Deploying the model for real-time inference
You now want to use the model to perform inference. For this post, that means predicting the images as weeds or grass.
This section involves the following steps:
- Create a model for the training output.
- Host the model for real-time inference. Create an inference endpoint and perform real-time inference. This consists of the following steps:
- Create a configuration that defines an endpoint.
- Use the configuration to create an inference endpoint.
- Perform inference on some input data using the endpoint.
Creating a model
Create a SageMaker Model from the training output using the following Python code:
Real-time inference
You can now host the model with an endpoint and perform real-time inference.
Creating an endpoint configuration
Create an endpoint configuration that Amazon SageMaker hosting services use to deploy models. See the following code:
Creating an endpoint
Create the endpoint that serves up the model by specifying the name and configuration you defined previously. The result is an endpoint that you can validate and incorporate into production applications. This takes approximately 9–11 minutes to complete on an m4.xlarge instance. See the following code:
Create the endpoint with the following code:
You can confirm the endpoint configuration and status on the Endpoints tab in the Amazon SageMaker console.
You can now create a runtime object from which you can invoke the endpoint.
Performing inference
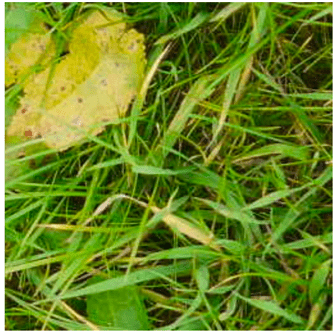
To validate the model for use, obtain the endpoint from the client library using the result from previous operations and generate classifications from the trained model using that endpoint. The code uses a sample image of a weed for our tests below. See the following code:
Running your model at the edge using AWS DeepLens
AWS DeepLens lets you experiment with deep learning at the edge, which gives you an easy way to deploy trained models and use Python code to come up with interesting applications. For your weed identifier, you could mount an AWS DeepLens device on a wire overlooking your lawn. The device feeds cropped images of detected weeds and crops to Amazon S3. It could even trigger a text to your mobile phone when it detects weeds.
An AWS DeepLens project consists of a trained model and an AWS Lambda function. The function uses AWS IoT Greengrass on AWS DeepLens to perform the following tasks:
- Capture the image from a video stream
- Perform an inference using that image against the deployed ML model
- Provide the results to AWS IoT and the output video stream
AWS IoT Greengrass lets you execute Lambda functions locally, which reduces the complexity of developing embedded software. For more information, see Create and Publish an AWS DeepLens Inference Lambda Function.
When you use a custom image classification model produced by Amazon SageMaker, there is an additional step in your AWS DeepLens inference Lambda function. The inference function needs to call MXNet’s model optimizer before performing any inference using your model. To optimize and load the model, see the following code:
Performing model inference on AWS DeepLens
Model inference from your Lambda function is very similar to the previous steps for invoking a model using an Amazon SageMaker hosted endpoint. The following Python code finds weeds and grass in a frame that the AWS DeepLens video camera provides:
For information about a complete inference Lambda function to use on AWS DeepLens with this image classification model, see the GitHub repo. Lambda function uses AWS IoT Greengrass SDK to publish text-based output on IoT topic in JSON format. Here are instructions on how to view the output in IoT Console.
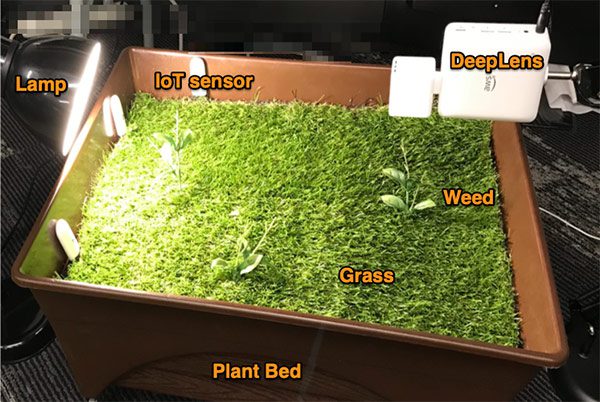
Below picture shows our sample setup :
Near real-time monitoring of the farm conditions
The right amount of water and nutrients are key to improving farm productivity. One of the ways you can achieve that is through real-time monitoring of the field, which helps you save costs on water and fertilizer consumption. The information collected from real-time monitoring can help you identify when and where to water or fertilize the soil.
To monitor the soil conditions, this post used four soil sensors and monitored a patch of a 2-feet-by-1-foot plant bed. These sensors can detect the current moisture level and fertility of the soil, light received, and temperature of the surroundings. It collects this information via Raspberry Pi with Bluetooth enabled. For actual production, you should use a much longer-range protocol like LoRa. Raspberry Pi polls the sensors, collects this information, and sends it to AWS IoT Core. You use an IoT rule to collect data and forward it to Amazon Kinesis Data Analytics for real-time analysis. Now, when the moisture level for a specific part of the farm falls below the threshold value, this would trigger an alert notification. You can also use this information to automate the control of sprinklers system.
The system also has built-in logic to poll the local weather conditions. You can use this information to decide when and if to turn the sprinklers on.
Architecture
The following diagram illustrates the architecture of this workflow.
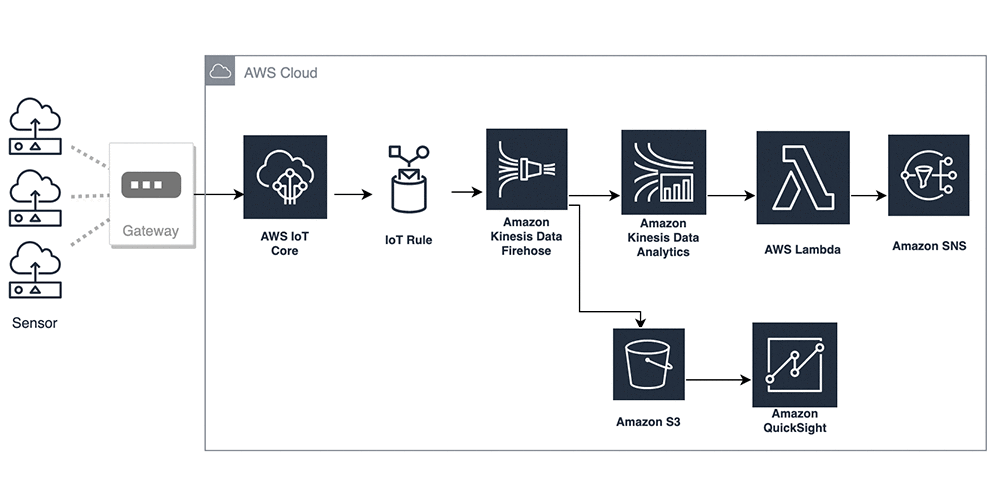
The architecture includes the following high-level steps:
- Raspberry Pi acts as an edge gateway device and collects information from soil moisture sensors via Bluetooth.
- After authentication, Raspberry Pi subscribes to an IoT topic and starts publishing messages to it.
- Using the IoT rule engine, data moves to Amazon Kinesis Data Firehose, which has two destinations: Amazon S3 for persistent storage and Kinesis Data Analytics for real time processing.
- The output of Kinesis Data Analytics is a Lambda function, which triggers SNS alerts when the moisture level falls below the threshold value.
- Finally, you use Amazon S3 data to build an Amazon QuickSight
To prepare this architecture, you need a Raspberry Pi and soil moisture sensors.
Setting up your IoT device
To set up a Raspberry Pi to generate the data, complete the following steps:
- Configure the Raspberry Pi and connect it to AWS IoT. For more information, see Using the AWS IoT SDKs on a Raspberry Pi
- Download the latest version of Python AWS IoT SDK on Raspberry Pi by either SSH or command prompt in PuTTY. You can use the pip3 program command. See the following code:
Use Python 3.4 or higher because the bltewrap library used for miflora sensors only works with Python 3.4 or above.
- Download the miflora sensor library to talk to sensors with the following code:
The code also automatically downloads the bltewrap library required for miflora. For more information, see the GitHub repo.
- Download the farmbot.py script from GitHub and update the following parameters:
-
- clientID – IoT and IoT shadow client ID (from step 1)
- configureEndpoint – IoT and IoT shadow endpoint from your AWS Management Console
- configureCredentials – IoT and IoT shadow credentials location on Raspberry Pi (from step 1)
- Sensors – Update the mac address values of the sensors
- SSH into Raspberry Pi and start the Python py script. The script polls the soil moisture sensors configured in the previous step. See the following code:
Creating a Firehose delivery stream with Lambda transformation
This post uses an Amazon Kinesis Data Firehose delivery stream to stream the data. You use the data from the Firehose delivery stream as input for Kinesis Data Analytics and also store it in Amazon S3 for building an Amazon QuickSight dashboard. To create your delivery stream, complete the following steps:
- On the Kinesis Data Firehose console, choose Create delivery stream.
- Create a Firehose delivery stream with the name
IoT-data-Stream. - Select the source as the default Direct PUT or other sources and leave Server side encryption to default as unchecked.
- Choose Next
- For Transform source records for AWS Lambda, select Enabled.
- Choose Create new.
- Using this Lambda function, add the new line character to the end of each record for the data sent from the delivery stream to Amazon S3. For more information, see the GitHub repo.
This is required to create a visualization in Amazon QuickSight. See the following code:
- For Convert record format, select disabled.
- Choose Next.
- For Destination, choose Amazon S3.
- Create a new S3 bucket named
-kinesis - Keep all other fields default.
- Choose Next.
- Under S3 buffer conditions, for Buffer interval, enter 60 seconds.
- For Buffer size, enter 1 MB.
- Choose Create an IAM role. Kinesis Data Firehose uses this role to access your bucket.
- Keep all other fields default.
- Choose Next.
- Review all the fields and choose Create delivery stream.
Setting up AWS IoT to forward data to the delivery stream
To forward data to your delivery stream, complete the following steps:
- On the AWS IoT Core console, choose Act.
- Choose Create rule.
- Create a new AWS IoT rule with the following field values:
- For the IAM role, choose Create new role.
The console creates an IAM role with the appropriate permissions for AWS IoT to access Kinesis Data Firehose. If you prefer to use an existing role, select the role from the drop-down menu and choose Update role. This adds the required permissions to your selected IAM role.
Creating the destination for the analytics application
To create the destination for the analytics application, complete the following steps:
- On the Amazon SNS console, create a topic and subscribe to it via email or text. For more information, see step 1 and step 2 of Getting Started with Amazon SNS
- Copy the ARN for the SNS topic in a text file.
Creating an analytics application to process the data
To create your analytics application, complete the following steps:
- On the Amazon Kinesis console, choose Data Analytics.
- Choose Create application.
- For your application name, enter
Farmbot-application. - For your runtime, select
SQLand choose Create application - For the source, choose Connect streaming data and select Choose source.
- Choose Kinesis Data Firehose delivery stream.
- Choose IoT-Source-Stream.
- Leave Record pre-processing with Lambda
- Under Access Permission, let the console create and update an IAM role to use with Kinesis Data Analytics.
If you already have an appropriate IAM role that Kinesis Data Analytics can assume, choose that role from the drop-down menu.
- Choose Discover Schema.
- Wait for the application to show results and then choose Save and continue.
If you have configured everything correctly, you see a table with the sensor names, parameters, and timestamp. See the following screenshot.

- For real-time analytics processing, choose Go to SQL editor.
- Enter the following parameters:
- SOURCE_SQL_STREAM_001 – Contains name and sensor parameters with value and timestamp from the incoming stream.
- INTERMEDIATE_SQL_STREAM – Contains all records with
Moisturevalue less than25and filters down to fewer parameters, which for this post isMoistureandConductivity. - DESTINATION_SQL_HHR_STREAM – Performs functions on the aggregate row over a 2-minute sliding window for a specified column. It detects if a sensor is constantly reporting low moisture level for 2 minutes.
See the following example code:
On the Real-time analytics tab, you can see the results of the SQL query. See the following screenshot.

Connecting the destination for the analytics application
To connect the destination for your analytics application, complete the following steps:
- For Destination, select AWS Lambda Function.
- Create a new Lambda function and choose the Lambda blueprint.
- In the search bar, enter
SNS. - Choose kinesis-analytics-output-sns .
- Enter the function name.
- Select output format as JSON
- For the execution role, select Create a new role with basic Lambda permissions.
The Lambda function processes the results of the application and sends the results to the SNS topic you created.
- Modify the following function code and add the topic ARN you recorded:
- Choose Create function.
- On the Kinesis Data Analytics console, under In-application stream, select Existing in-application stream.
- From the drop-down menu, choose DESTINATION_SQL_HHR_STREAM with JSON output format.
- Under Access permission select create or update an IAM role to use with Kinesis Data Analytics.
If you already have an appropriate IAM role that Kinesis Data Analytics can assume, choose that role from the drop-down menu.
Connecting Amazon QuickSight for data visualization
To build an Amazon QuickSight dashboard, you need to ingest the JSON raw data from Kinesis Data Firehose. Complete the following steps:
- On the console, choose QuickSight.
If you are using Amazon QuickSight for the first time, you must create a new account.
- After you log in, choose New analysis.
- Choose New data set.
- From the available source, choose S3.
- Enter data source name.
- Select to upload the manifest file.
The manifest file provides the location of the S3 bucket and the format of data in Amazon S3. For more information, see Supported Formats for Amazon S3 Manifest Files. See the following example code:
Amazon QuickSight imports and parses the data.
- To transform and format the ingested data, choose Edit/Preview data.
- After you are done formatting, choose Save and visualize data.
To build an analysis on the visualization screen, complete the following steps:
- For Visual type, choose Line Chart.
- Drag and drop the
DateTimefield to the Field Wells X-axis. - Move
Lightto the Value - Move
Nameto the Color
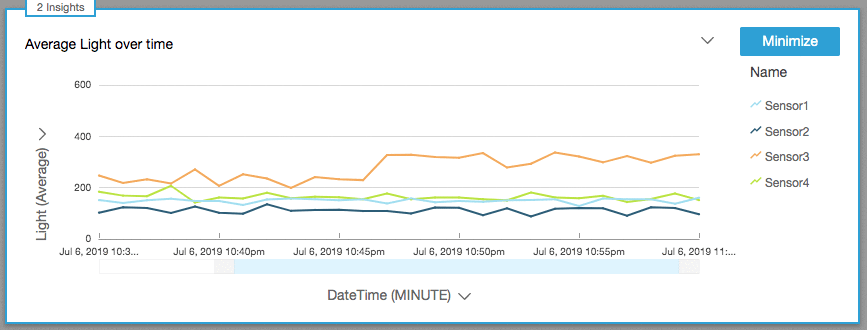
This builds a dashboard that shows the amount of light over a period of time for the four sensor locations.
- Change the
DateTimeaggregate option fromDAYtoMINUTE. - Change
LightfromSumtoAverage. - Choose the format visual option to change the X-axis, Y-axis, or legend properties.

The following graph shows the average light over time. You can similarly build one for moisture, temperature, and soil fertility level.
Conclusion
This post showed how to use AWS DeepLens and the built-in image classification algorithm in Amazon SageMaker to detect weeds from grass based on a publicly available dataset and build a real-time lawn monitoring system using Amazon Kinesis and AWS IoT. You can also visualize data using Amazon QuickSight. You can clone and extend this example for your own use cases.
About the Authors
 Ravi Gupta is an Enterprise Solutions Architect at Amazon web services. He is a passionate technology enthusiast who enjoys working with customers and helping them build innovative solutions. His core areas of focus are IoT, Analytics and Machine learning. In his spare time, Ravi enjoys spending time with his family and photography.
 Shayon Sanyal is a Senior Data Architect (Data Lake) with Global Financial Services at Amazon Web Services. He enables AWS customers and partners to solve complex and challenging AI/ML, IoT, and Data Analytics problems and helps them realize their vision of a data-driven enterprise. In his spare time, Shayon enjoys traveling, running and hiking.
Tags: Archive

Leave a Reply