Population health applications with Amazon HealthLake – Part 1: Analytics and monitoring using Amazon QuickSight
Healthcare has recently been transformed by two remarkable innovations: Medical Interoperability and machine learning (ML). Medical Interoperability refers to the ability to share healthcare information across multiple systems. To take advantage of these transformations, we launched a new HIPAA-eligible healthcare service, Amazon HealthLake, now in preview at re:Invent 2020. In the re:Invent announcement, we talk about how HealthLake enables organizations to structure, tag, index, query, and apply ML to analyze health data at scale. In a series of posts, starting with this one, we show you how to use HealthLake to derive insights or ask new questions of your health data using advanced analytics.
The primary source of healthcare data are patient electronic health records (EHR). Health Level Seven International (HL7), a non-profit standards development organization, announced a standard for exchanging structured medical data called the Fast Healthcare Interoperability Resources (FHIR). FHIR is widely supported by healthcare software vendors and was supported at an American Medical Informatics Association meeting by EHR vendors. The FHIR specification makes structured medical data easily accessible to clinical researchers and informaticians, and also makes it easy for ML tools to process this data and extract valuable information from it. For example, FHIR provides a resource to capture documents, such as doctor’s notes or lab report summaries. However, this data needs to be extracted and transformed before it can be searched and analyzed.
As the FHIR-formatted medical data is ingested, HealthLake uses natural language processing trained to understand medical terminology to enrich unstructured data with standardized labels (such as for medications, conditions, diagnoses, and procedures), so all this information can be normalized and easily searched. One example is parsing clinical narratives in the FHIR DocumentReference resource to extract, tag, and structure the medical entities, including ICD-10-CM codes. This transformed data is then added to the patient’s record, providing a complete view of all of the patient’s attributes (such as medications, tests, procedures, and diagnoses) that is optimized for search and applying advanced analytics. In this post, we walk you through the process of creating a population health dashboard on this enriched data, using AWS Glue, Amazon Athena, and Amazon QuickSight.
Building a population health dashboard
After HealthLake extracts and tags the FHIR-formatted data, you can use advanced analytics and ML with your now normalized data to make sense of it all. Next, we walk through using QuickSight to build a population health dashboard to quickly analyze data from HealthLake. The following diagram illustrates the solution architecture.
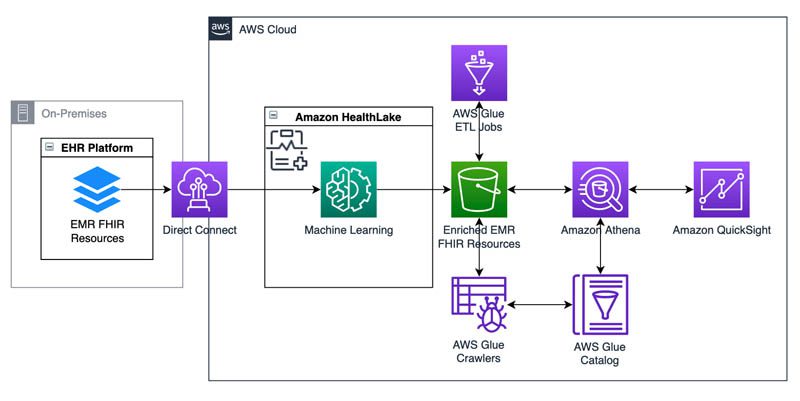
In this example, we build a dashboard for patients diagnosed with congestive heart failure (CHF), a chronic medical condition in which the heart doesn’t pump blood as well as it should. We use the MIMIC-III (Medical Information Mart for Intensive Care III) data, a large, freely-available database comprising de-identified health-related data associated with over 40,000 patients who stayed in critical care units of the Beth Israel Deaconess Medical Center between 2001–2012. [1]
The tools used for processing the data and building the dashboard include AWS Glue, Athena, and QuickSight. AWS Glue is a serverless data preparation service that makes it easy to extract, transform, and load (ETL) data, in order to prepare the data for subsequent analytical processing and presentation in charts and dashboards. An AWS Glue crawler is a program that determines the schema of data and creates a metadata table in the AWS Glue Data Catalog that describes the data schema. An AWS Glue job encapsulates a script that reads, processes, and writes data to a new schema. Finally, we use Athena, an interactive query service that can query data in Amazon Simple Storage Service (Amazon S3) using standard SQL queries on tables in a Data Catalog.
Connecting Athena with HealthLake
We first convert the MIMIC-III data to FHIR format and then copy the formatted data into a data store in HealthLake, which extracts medical entities from textual narratives such as doctors’ notes and discharge summaries. The clinical notes are stored in the DocumentReference resource, whereby the extracted entities are tagged to each patient’s record in the DocumentReference with FHIR extension fields represented in the JSON object. The following screenshot is an example of how the augmented DocumentResource looks.

Now that data is indexed and tagged in the HealthLake, we export the normalized data to an S3 bucket. The exported data is in NDJSON format, with one folder per resource.

An AWS Glue crawler is written for each folder to crawl the NDJSON file and create tables in the Data Catalog. Because the default classifiers can work with NDJSON files directly, no special classifiers are needed. There is one crawler per FHIR resource and each crawler creates one table. These tables are then queried directly from within Athena; however, for some queries, we use AWS Glue jobs to transform and partition the data to make the queries simpler and faster.
We create two AWS Glue jobs for this project to transform the DocumentReference and Condition tables. Both jobs transform the data from JSON to Apache Parquet, to improve query performance and reduce data storage and scanning costs. In addition, both jobs partition the data by patient first, and then by the identity of the individual FHIR resources. This improves the performance of patient- and record-based queries issued through Athena. The resulting Parquet files are tabular in structure, which also simplifies queries issued via clients, because they can reference detected entities and ICD-10 codes directly, and no longer need to navigate the nested FHIR structure of the DocumentReference extension element. After these jobs create the Parquet files in Amazon S3, we create and run crawlers to add the table schema into the Data Catalog.
Finally, to support keyword-based queries for conditions via the QuickSight dashboard, we create a view of the transformed DocumentReference table that includes ICD-10-CM textual descriptions and the corresponding ICD-10-CM codes.
Building a population health dashboard with QuickSight
QuickSight is a cloud-based business intelligence (BI) services that makes it easy to build dashboards in the cloud. It can obtain data from various sources, but for our use case, we use Athena to create a data source for our QuickSight dashboard. From the previous step, we have Athena tables that use data from HealthLake. As the next step, we create a dataset in QuickSight from a table in Athena. We use SPICE (Super-fast, Parallel, In-memory Calculation Engine) to store the data because this allows us to import the data only one time and use it multiple times.
After creating the dataset, we create a number of analytic components in the dashboard. These components allow us to aggregate the data and create charts and time-series visualizations at the patient and population levels.
The first tab of the dashboard that we build provides a view into the entire patient population and their encounters with the health system (see the following screenshot). The target audience for this dashboard consists of healthcare providers or caregivers.
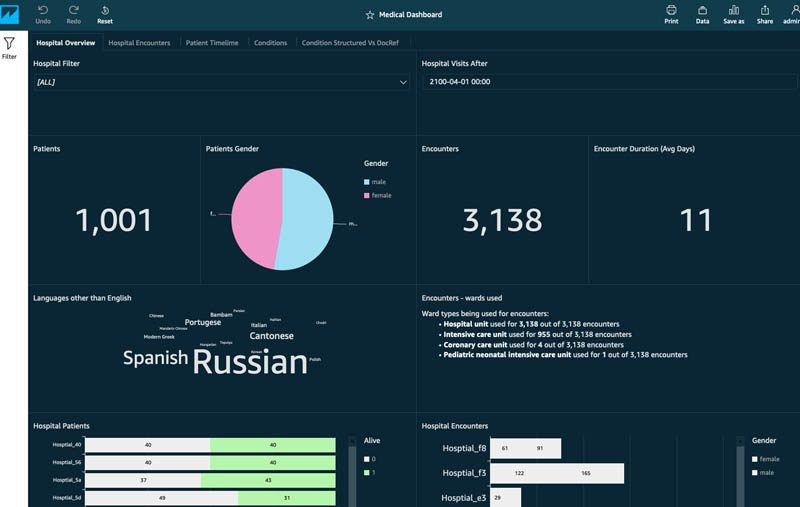
The dashboard contains filters that allows us to further drill on the results by referring hospital or by date. It shows the number of patients, their demographic distribution, the number of encounters, the average hospital stay, and more.
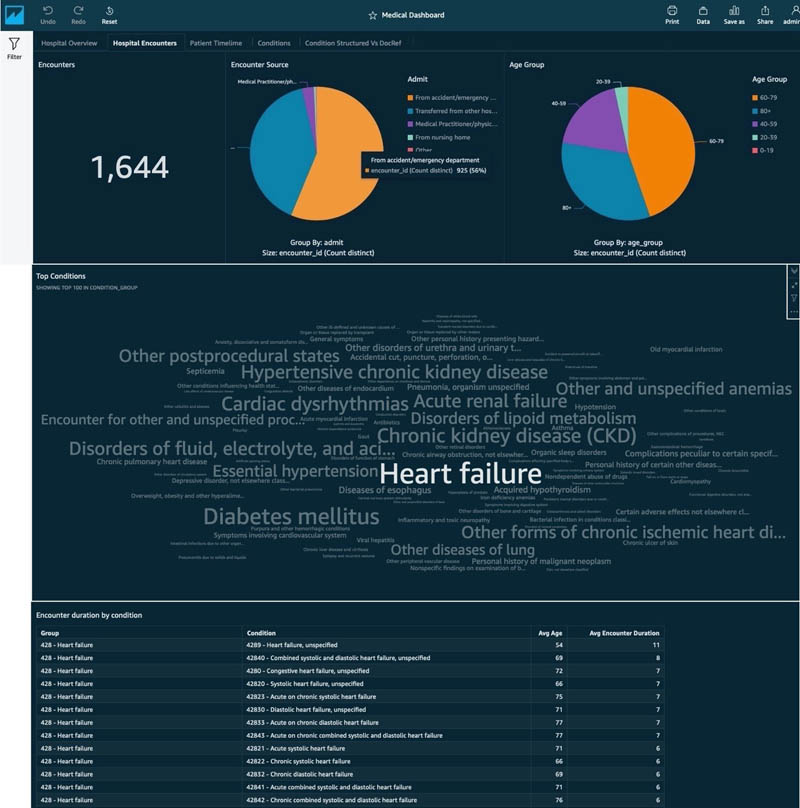
The second tab joins hospital encounters with patient medical conditions. This view provides the number of encounters per referring hospital, broken by type of encounter and by age. We also create a word cloud for major medical conditions to easily drill down on the details and understand the distribution of these conditions across the entire population by encounter type.
The third component contains a patient timeline. The timeline is in the form of a tree table. The first column is the patient name. The second column contains the start date of the encounter sorted chronologically. The third column contains the list of ranked conditions diagnosed in that encounter. The last column contains the list of procedures performed during that encounter.
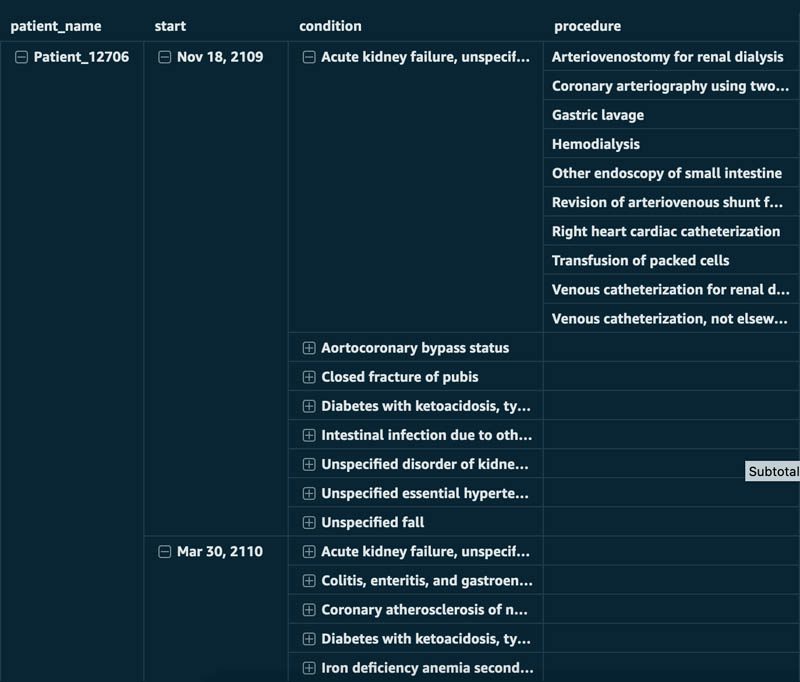
To build the patient timeline, we create a view in Athena that joins multiple tables. We build the preceding view by joining the condition, patient, encounter, and observation tables. The encounter table contains an array of conditions, and therefore we need to use the unnest command. The following code is a sample SQL query to join the tables:
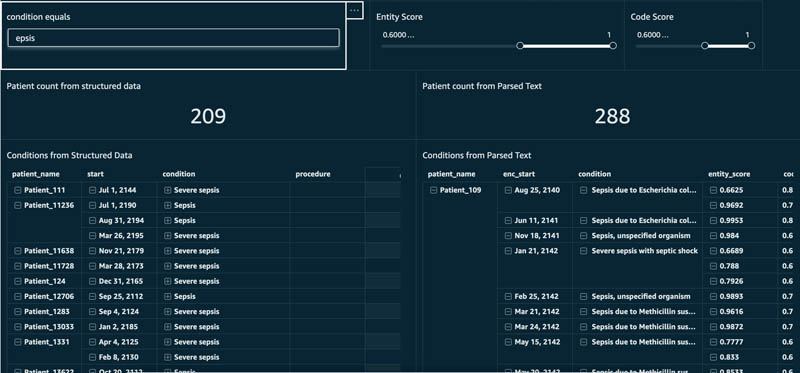
The last but probably most exciting part is where we compare patient data found in structured fields vs. data parsed from text. As described before, the AWS Glue job has transformed the DocumentReference and Condition table so that the modified DocumentReference tables can now be queried to retrieve parsed medical entities.
In the following screenshot, we search for all patients that have the word [s]epsis in the condition text. The condition equals field is a filter that allows us to filter all conditions that match a text. The results show that 209 patients have a sepsis-related condition in their structured data. However, 288 patients have sepsis-related conditions as parsed from textual notes. The table on the left shows timelines for patients based on structured data, and the table on right shows timelines for patients based on parsed data.
Next steps
In this post, we joined the data from multiple FHIR references to create a holistic view for a patient. We also used Athena to search for a single patient. If the data volume is high, it’s a good idea to create year, month, and day partitions within Amazon S3 and store the NDJSON files in those partitions. This allows the dashboard to be created for a restricted time period, such as current month or current year, making the dashboard faster and cost-effective.
Conclusion
HealthLake creates exciting new possibilities for extracting medical entities from unstructured data and quickly building a dashboard on top of it. The dashboard helps clinicians and health administrators make informed decisions and improve patient care. It also helps researchers improve the performance of their ML models by incorporating medical entities that were hidden in unstructured data. You can start building a dashboard on your raw FHIR data by importing it into Amazon S3, creating AWS Glue crawlers and Data Catalog tables, and creating a QuickSight dashboard!
[1] MIMIC-III, a freely accessible critical care database. Johnson AEW, Pollard TJ, Shen L, Lehman L, Feng M, Ghassemi M, Moody B, Szolovits P, Celi LA, and Mark RG. Scientific Data (2016).
About the Author
 Mithil Shah is an ML/AI Specialist at Amazon Web Services. Currently he helps public sector customers improve lives of citizens by building Machine Learning solutions on AWS.
 Paul Saxman is a Principal Solutions Architect at AWS, where he helps clinicians, researchers, executives, and staff at academic medical centers to adopt and leverage cloud technologies. As a clinical and biomedical informatics, Paul is passionate about accelerating healthcare advancement and innovation, by supporting the translation of science into medical practice.
Tags: Archive

Leave a Reply