Building algorithmic trading strategies with Amazon SageMaker
Financial institutions invest heavily to automate their decision-making for trading and portfolio management. In the US, the majority of trading volume is generated through algorithmic trading. [1]
With cloud computing, vast amounts of historical data can be processed in real time and fed into sophisticated machine learning (ML) models. This allows market participants to discover and exploit new patterns for trading and asset managers to use ML models to construct better investment portfolios.
In this post, we explain how to use Amazon SageMaker to deploy algorithmic trading strategies using ML models for trade decisions. In the following sections, we go over the high-level concepts. The GitHub repo has the full source code in Python.
Solution overview
The key ingredients for our solution are the following components:
- SageMaker on-demand notebooks to explore trading strategies and historical market data
- Training and inference of ML models in a built-in container with Amazon SageMaker
- Backtrader, an open-source Python framework, for backtesting trading strategies and for writing reusable strategies, indicators, and analyzers
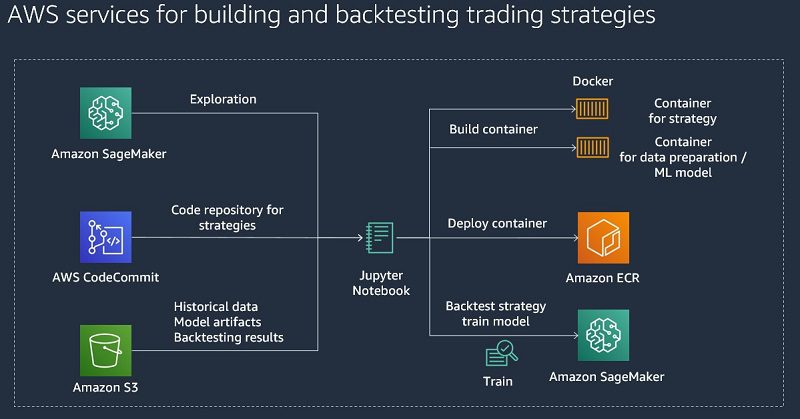
Architecture for building and backtesting of trading strategies
We use Jupyter notebooks as our central interface for exploring and backtesting new trading strategies. Amazon SageMaker allows you to set up Jupyter notebooks and integrate them with AWS CodeCommit to store different versions of strategies and share them with other team members.
Because we want to focus on ML-based strategies, we need a scalable data store, so we use Amazon Simple Storage Service (Amazon S3) to store historical market data, model artifacts, and backtesting results.
For our trading strategies, we create Docker containers that contain the required libraries for backtesting and the strategy itself. These containers follow the SageMaker Docker container structure in order to run them inside of SageMaker along with the ML models. For more information about the structure of SageMaker containers, see Using the SageMaker Training and Inference Toolkits.
An advantage to this approach is that we can use the same APIs and the SageMaker management console for ML and backtesting.
The following diagram illustrates this architecture.
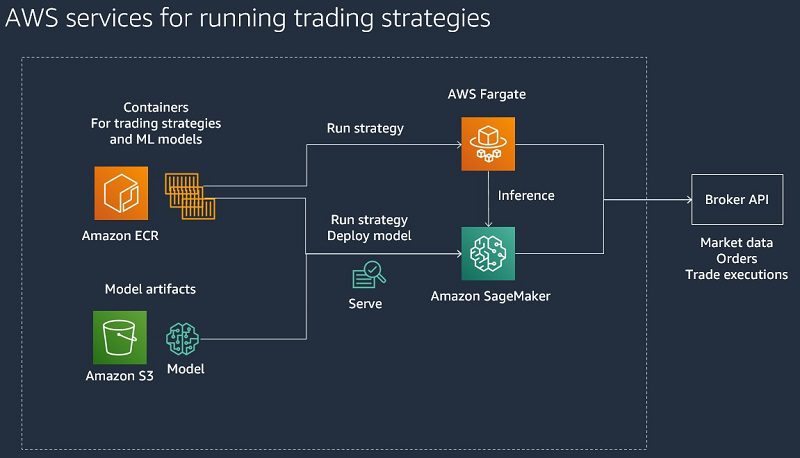
Architecture for hosting of trading strategies
For live trading, we assume that we can run trading strategies in a container that connects to a broker that provides market data, takes orders, and notifies about trades. To host the containers, we can use SageMaker or AWS Fargate. SageMaker can host the ML models that we use for trade decisions.
The following diagram illustrates this architecture.
In the following sections, we focus on backtesting and ML for algorithmic trading strategies.
Backtesting trading strategy
For backtesting, we use an open-source backtesting framework. This approach works similarly with other backtesting frameworks as long as they can be run in a Docker container. Defining an algorithmic trading strategy generally follows four steps:
- Initialize the backtesting engine. This defines the slippage models and commission schemes.
- Add data feeds. This step adds price data to the backtesting engine and usually contains open, high, low, and close (OHLC) prices and volume information for a certain period.
- Add analyzers. This step defines what performance metrics should be calculated for the trading strategy. Common metrics are Sharpe Ratio or Total Profit and Loss.
- Add the strategy code. This includes code that defines the initial state and the technical indicators that we want to use for a strategy. The second part is the actual strategy code that runs for each price update and defines what orders to run under certain conditions. Orders can be market orders that run at the current price or limit orders with a predefined price.
To run the backtest in SageMaker, we build and deploy our SageMaker-compatible container that contains the trading strategy to Amazon Elastic Container Registry (Amazon ECR) and then run it with the following command:
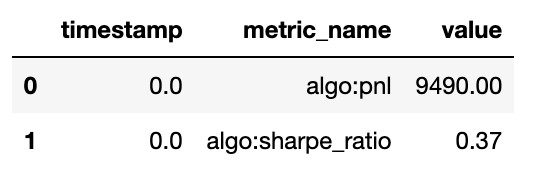
When the backtest is complete, we can get the performance metrics that we defined earlier by running the following command:
The following screenshot shows our results.
When the training job is complete, SageMaker stores the data for the trained model in Amazon Simple Storage Service (Amazon S3). For our use case, we run a backtest and use this feature to store a chart for the trading strategy. With the following command, you can visualize it in the notebook:
The following screenshot shows our visualization.
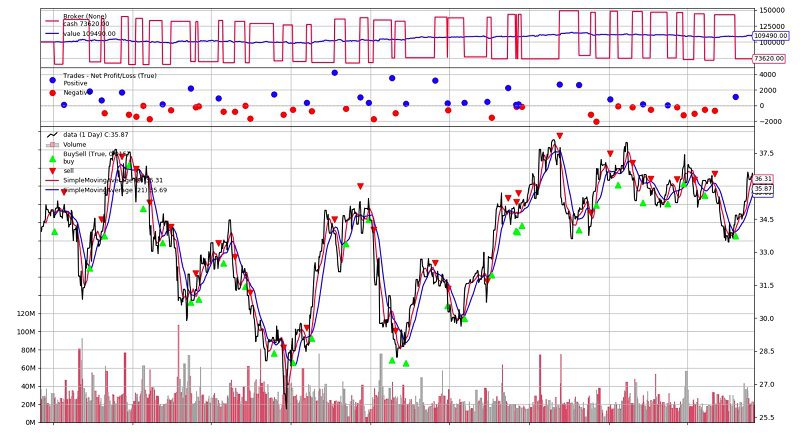
To get a better understanding how this works for a simple strategy without ML, you can run the detailed steps in the Strategy_SMA.ipynb Jupyter notebook for backtesting a moving average crossover strategy with SageMaker. Before you can use the notebooks, follow the instructions on the GitHub repo for setting up the required infrastructure and loading some sample historical price data.
Training the ML model
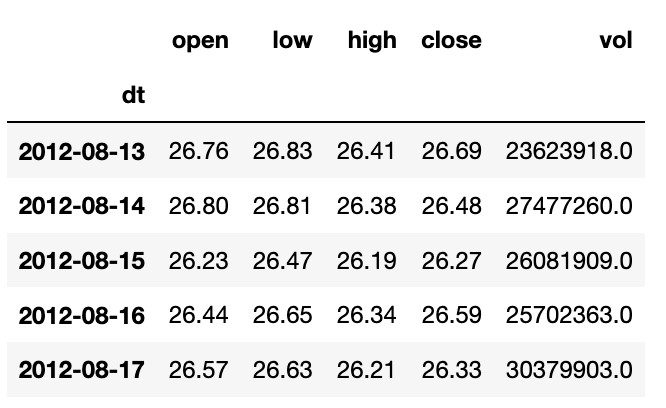
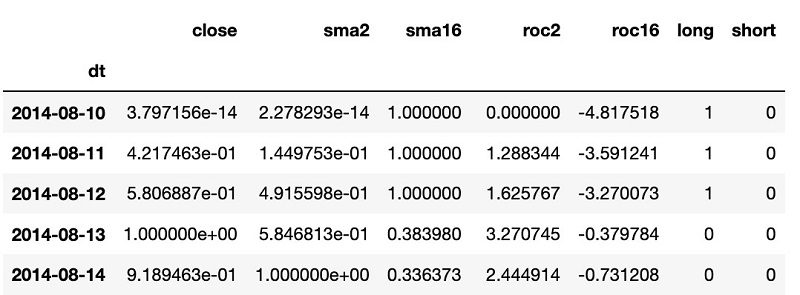
For an ML-based trading strategy, we need to frame the ML problem for our strategy and then train it with SageMaker. In our example, we use daily historical stock prices, and we train a binary classification model that predicts if a given price target will be reached in the near future based on historical prices and technical indicators. For the technical indicators, we calculate SMA (simple moving average) and ROC (rate of change) over different periods, from a few days up to several days. The last close and SMA prices are normalized between 0–1. We label each dataset with a long and short column that describes if we reached the profit target for a long or short trade without being stopped out in the next few days.
The following screenshot shows a sample of our original data.
For the ML model, the training data has the following structure:
- Input – Close, SMA(2), …, SMA(n), ROC(2), …, ROC(n)
- Output – Long Successful, Short Successful (0=no, 1=yes)
The following screenshot shows a sample of our training data.
To train the model in SageMaker, we build and deploy our SageMaker-compatible container to Amazon ECR and then train it with the following command:
You can run the detailed steps in the Train_Model_Forecast.ipynbJupyter Notebook.
After you complete the notebook, we have a trained model on 40% of the historical data. We can host it in SageMaker for inference or combine the model artifact directly with the SageMaker container for the trading strategy.
Backtesting the ML-based strategy
For our ML-based strategy, we take a simple approach. We take our trained classification model and predict at each price update if a long or short trade is profitable in the following days. If the model predicts with a threshold higher than 50% that a long or short trade is profitable, we take the trade and aim for a percentage-based profit target and protect it with a percentage-based stop-loss.
You can follow the detailed steps in the Strategy_ML_Forecast.ipynb Jupyter notebook for backtesting this strategy on the remaining 60% of historical data.
After you run through the notebook, you can review the performance metrics and analyze the buy and sell orders for your ML-based strategy.
Conclusion
SageMaker provides a flexible and scalable solution for the development of algorithmic trading strategies, especially when combined with ML. With more advanced ML models like reinforcement learning, algorithmic trading and portfolio investment will fundamentally change in the future and more innovation is expected in this space. For more information, see Portfolio Management with Amazon SageMaker RL.
In this blog post, we described how to use SageMaker for backtesting of machine learning-based trading strategies. An important component is the data that can be used for machine learning and a scalable solution for storing and querying financial data is required. To accelerate setting up an environment for storing and querying your financial data, you can use Amazon FinSpace that provides a turnkey service designed for financial services customers with data management and integrated notebooks for analytics. More details can be found in this blog post.
Risk disclaimer
This post is for educational purposes only and past trading performance does not guarantee future performance.
References
[1] “The stock market is now run by computers, algorithms and passive managers”, 2019: https://www.economist.com/briefing/2019/10/05/the-stockmarket-is-now-run-by-computers-algorithms-and-passive-managers
About the Author
 Oliver Steffmann is a Solutions Architect at AWS based in New York and brings over 18 years of experience in designing and delivering trading and risk solutions for financial service customers. Oliver leverages his knowledge of Big Data and Machine Learning to help customers with their digital transformation.
Tags: Archive

Leave a Reply