Train models faster with an automated data profiler for Amazon Fraud Detector
Amazon Fraud Detector is a fully managed service that makes it easy to identify potentially fraudulent online activities, such as the creation of fake accounts or online payment fraud. Amazon Fraud Detector uses machine learning (ML) under the hood and is based on over 20 years of fraud detection expertise from Amazon. It automatically identifies potentially fraudulent activity in milliseconds—with no ML expertise required.
To train a model in Amazon Fraud Detector, you need to supply a historical dataset. Amazon Fraud Detector doesn’t require any data science knowledge to use; however, it does have certain requirements on the data quality and formats to ensure the robustness of the ML models. You may sometimes encounter model training errors due to simple format and validation errors, which lead to extra time and effort to re-prepare the data and retrain the model. In addition, Amazon Fraud Detector requires you to define a variable type for each variable in the dataset during model creation. It may be helpful to have suggestions on selecting Amazon Fraud Detector variable types based on your data statistics.
In this post, we present an automated data profiler for Amazon Fraud Detector. It can generate an intuitive and comprehensive report of your dataset, which includes suggested Amazon Fraud Detector variable types for each variable in the dataset, and data quality issues that may potentially fail model training or hurt model performance. The data profiler also provides an option to reformat and transform the dataset to satisfy requirements in Amazon Fraud Detector, which can avoid some potential validation errors in model training. This automated data profiler is built with an AWS CloudFormation stack, which you can easily launch with a few clicks, and it doesn’t require any data science or programming knowledge.
Overview of solution
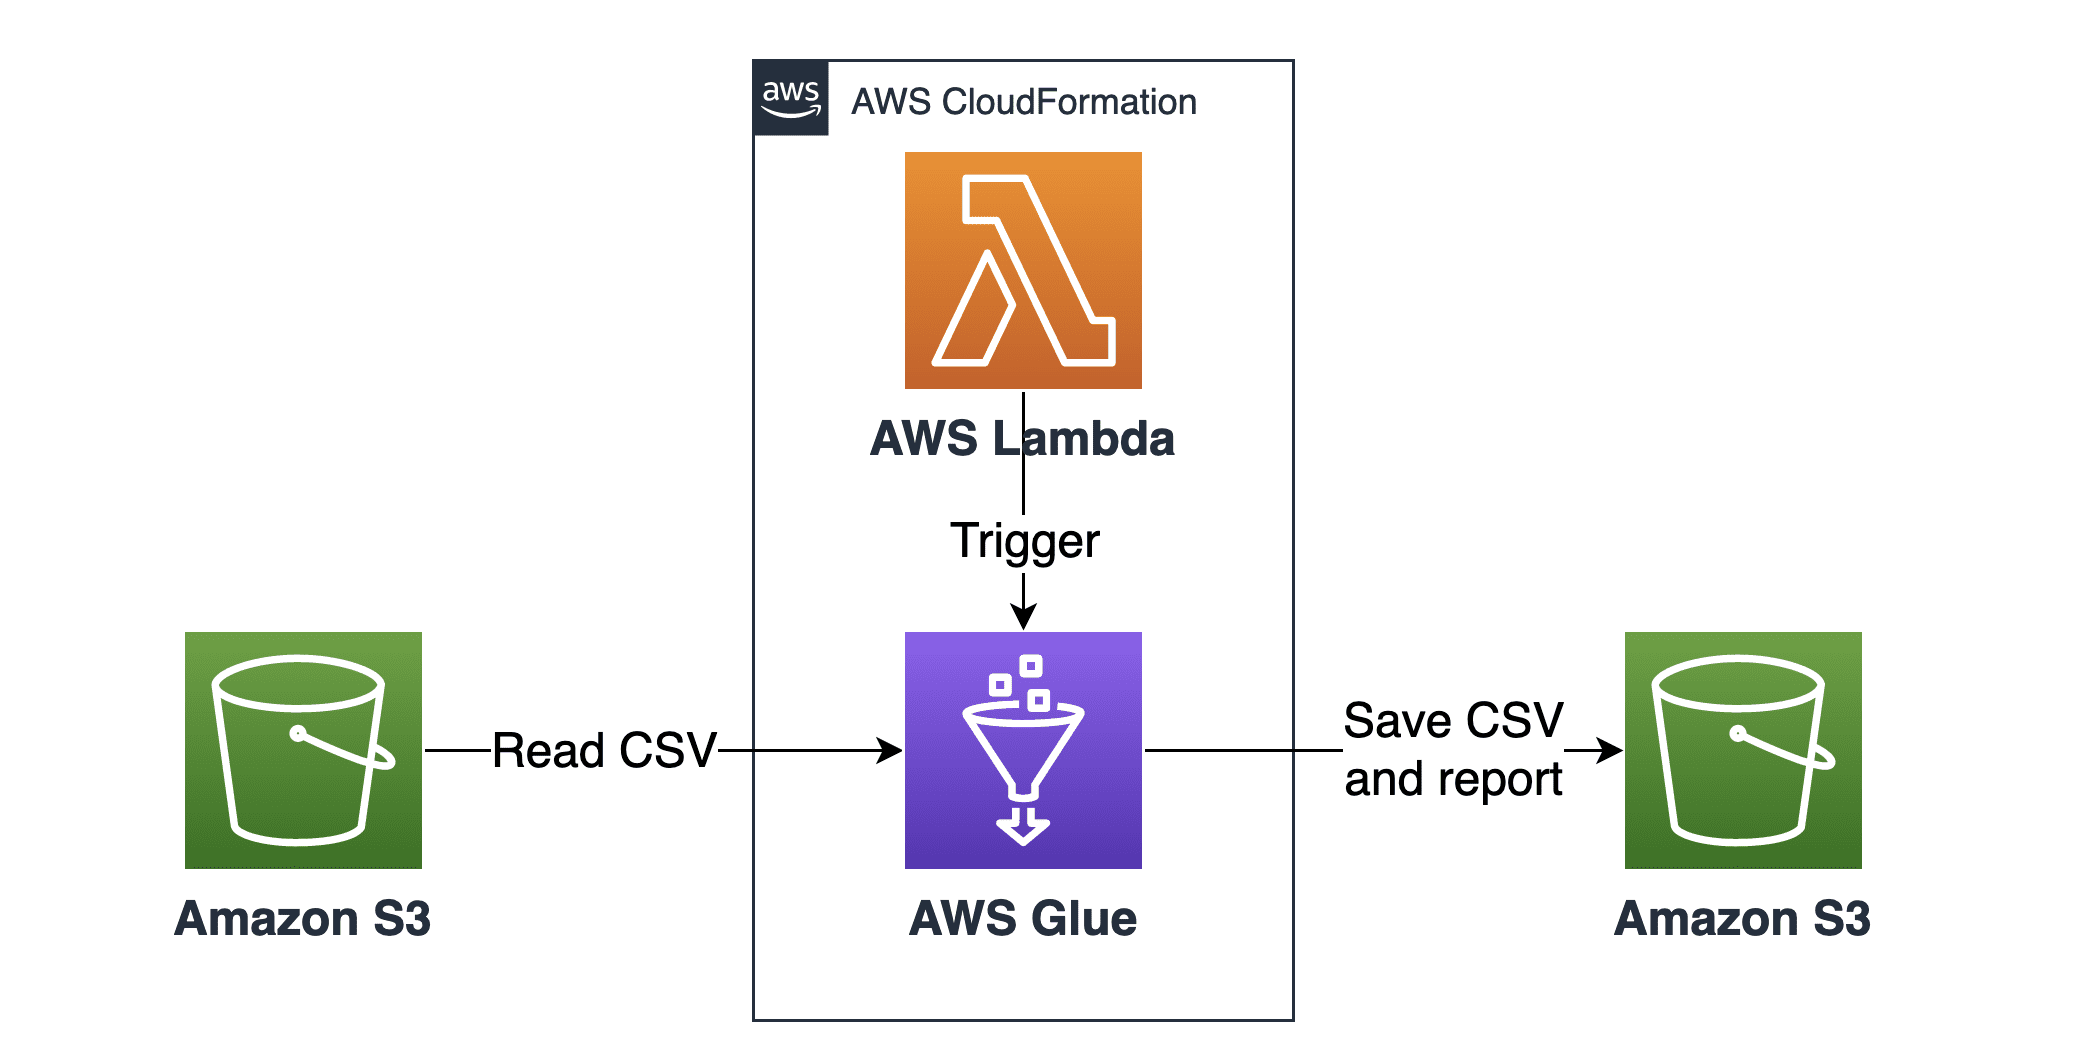
The following diagram illustrates the architecture of the automated data profiler, which uses AWS Glue, AWS Lambda, Amazon Simple Storage Service (Amazon S3), and AWS CloudFormation.
You can launch the data profiler with the quick launch feature of AWS CloudFormation. The stack creates and triggers a Lambda function, which automatically triggers an AWS Glue job. The AWS Glue job reads your CSV data file, profiles and reformats your data, and saves the HTML report file and formatted copy of the CSV to an S3 bucket.
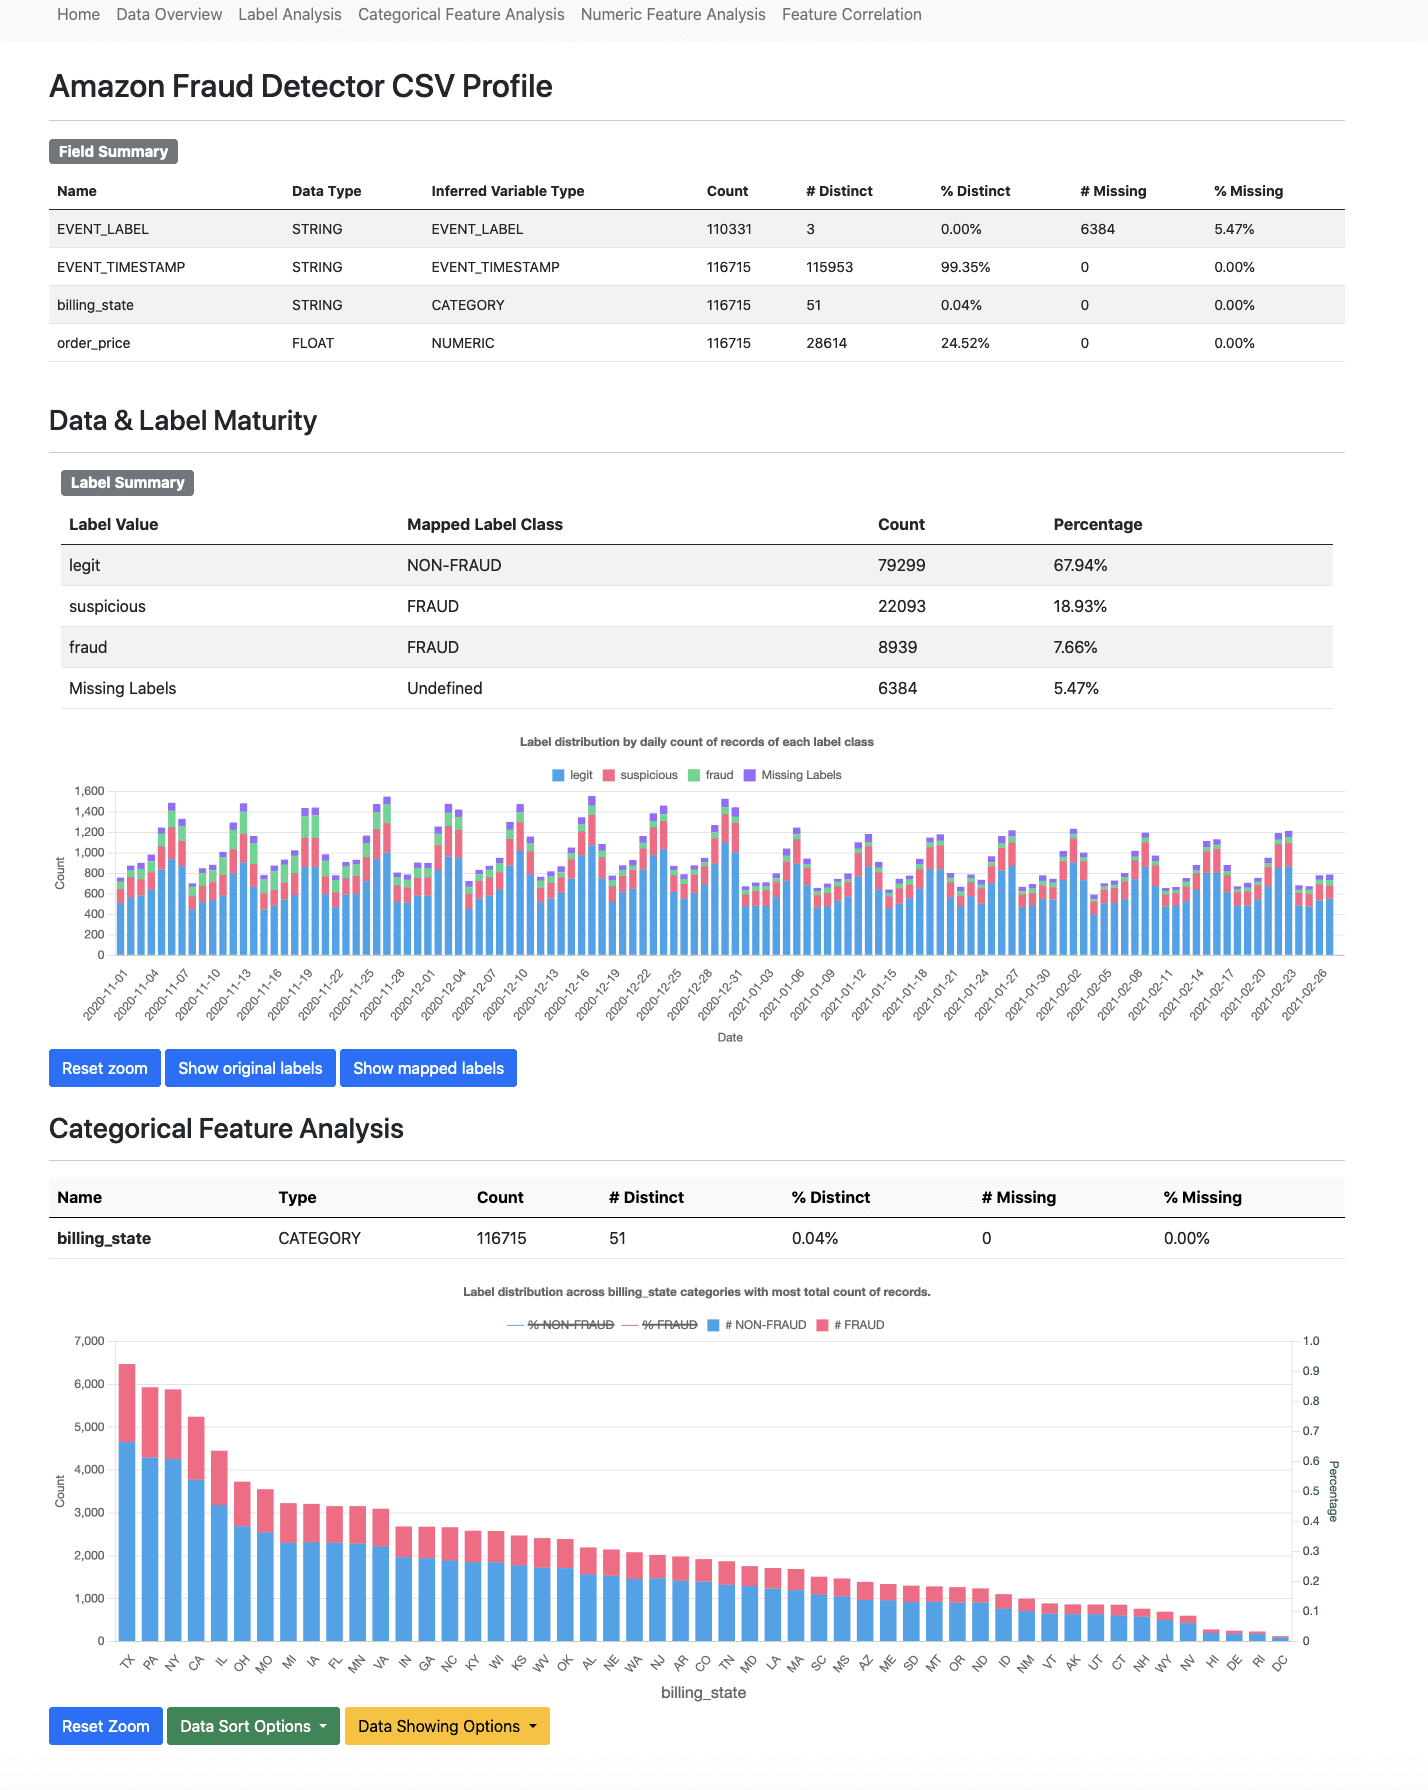
The following screenshot shows a sample profiling report. You can also view the full sample report.
The sample report, synthetic dataset, and codes of the automated data profiler are available on GitHub.
Launch the data profiler
Follow these steps to launch the profiler:
- Choose the following AWS CloudFormation quick launch link.

This opens an AWS CloudFormation quick launch page.
- Choose your Region to create all the resources in that Region.
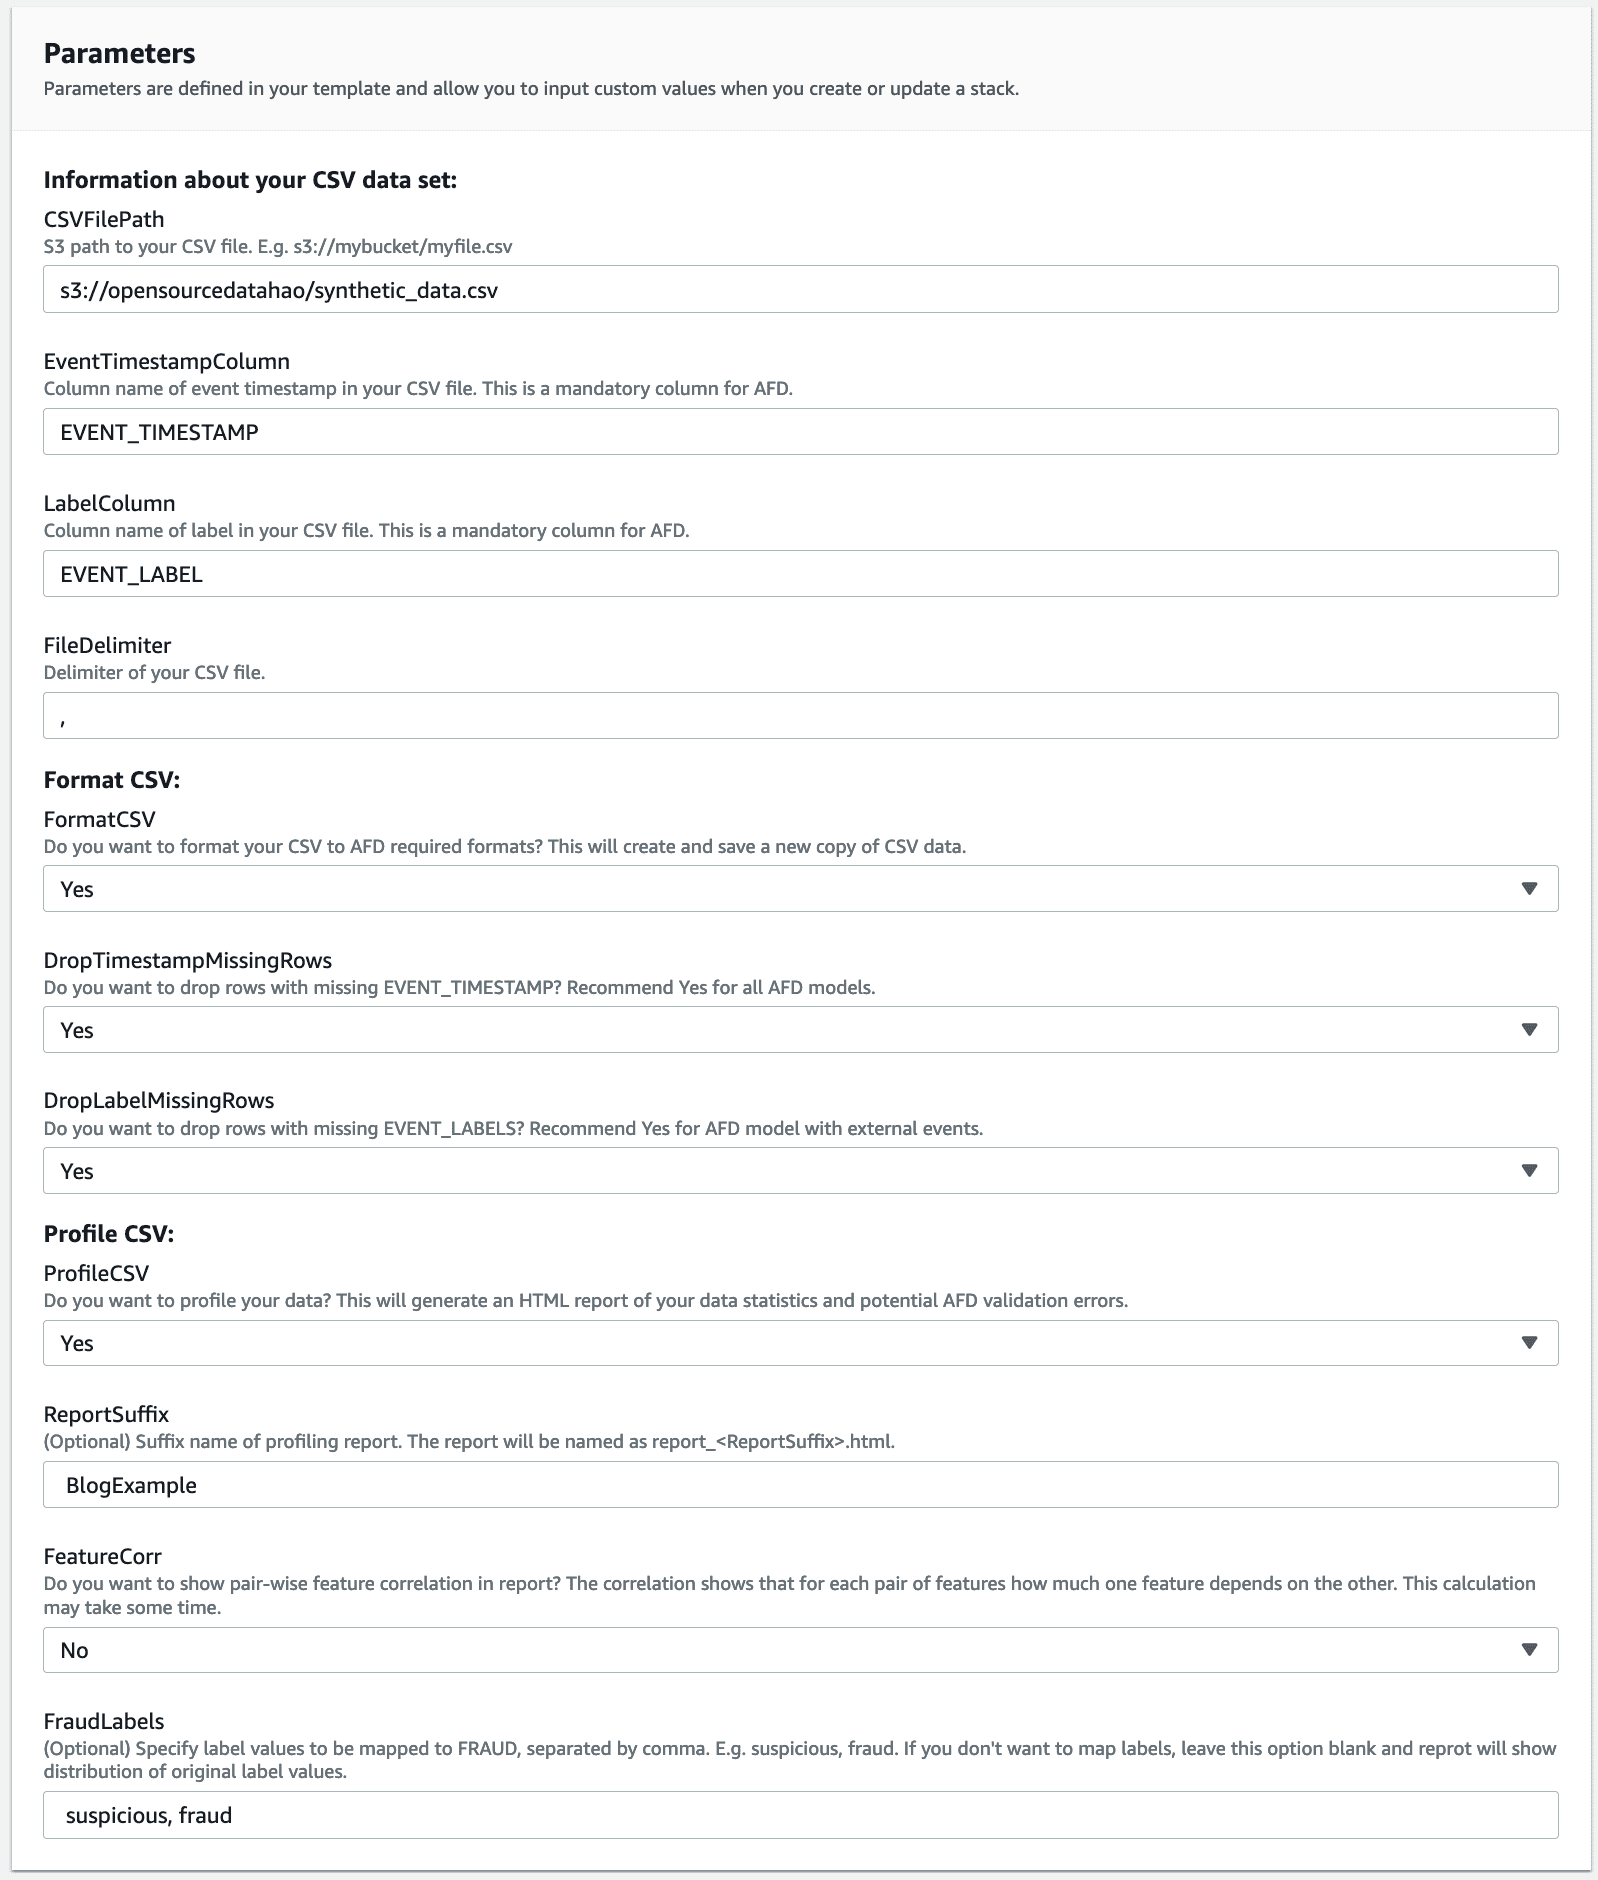
- For CSVFilePath, enter S3 path to your CSV file.
The output profiling report and formatted CSV file are saved under the same bucket.
- For EventTimestampColumn, enter the header name of the event timestamp column.
This is a mandatory column required by Amazon Fraud Detector. The data formatter converts this header name to EVENT_TIMESTAMP.
- For LabelColumn, enter the header name of the label column.
This is a mandatory column required by Amazon Fraud Detector. The data formatter converts this header name to EVENT_LABEL.
- For FileDelimiter, enter the delimiter of your CSV file (by default, this is a comma).
- For FormatCSV, choose whether you want to format the CSV file to the Amazon Fraud Detector required format (by default, this is Yes).
This transforms the header names, timestamp formats, and label formats. The formatted copy of your CSV data is saved in the same bucket as the input CSV.
- For DropTimestampMissingRows, choose whether you want to drop rows with missing timestamp in the formatted copy of the CSV.
Events with a missing timestamp aren’t used by Amazon Fraud Detector, and may cause validation errors, so we suggest setting this to Yes.
- For DropLabelMissingRows, choose whether you want to drop rows with missing labels.
- For ProfileCSV, choose whether you want to profile the CSV file (by default, this is Yes).
This generates a profiling report of your CSV data and saves it in the same bucket as the input CSV.
- For ReportSuffix (Optional), specify a suffix for the report (the report is named
report_)..html - For FeatureCorr, choose whether you want to show pair-wise feature correlation in the profiling report.
The correlation shows for each pair of features, how much one feature depends on the other. Note that computing pair-wise feature correlation takes an additional 10–20 minutes, so the option is set to No by default.
- For FraudLabels (Optional), specify which label values should be considered as fraud.
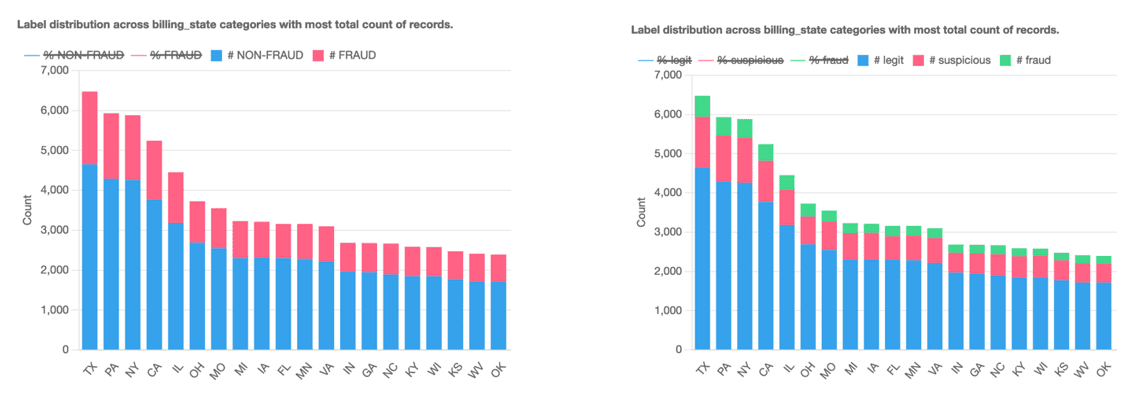
The report shows the distribution of mapped labels, namely fraud and non-fraud. You can specify multiple label values by separating with a comma, for example, suspicious, fraud. If you leave this option blank, the report shows the distribution of the original label values.
The following example plots illustrate using FraudLabels=’suspicious,fraud’ (left) and empty FraudLabels (right).
Wait a few minutes for the following resources to be created:
- DataAnalyzerGlueJob – The AWS Glue job that profiles and formats your data.
- AWSGlueJobRole – The AWS Identity and Access Management (IAM) role for the AWS Glue job with
AWSGlueServiceRoleandAWSGlueConsoleFullAccesspolicies. It also has a customer managed policy with permissions to read and write files to the bucket defined inCSVFilePath. - S3CustomResource and AWSLambdaFunction – The helper Lambda function and AWS CloudFormation resource to trigger the AWS Glue job.
- AWSLambdaExecutionRole – The IAM role for the Lambda function to trigger the AWS Glue job with
AWSGlueServiceNotebookRole,AWSGlueServiceRole, andAWSLambdaExecutepolicies.
- When the AWS Glue job is complete, which is typically a few minutes after the stack creation, open the output S3 bucket.
If your input file S3 path is s3://my_bucket/my_file.csv, the output files are saved under the folder s3://my_bucket/afd_data_my_file.

Examine the data profiler report
The data profiler generates an HTML report that lists your data statistics. We use a synthetic dataset to walk you through each section of the report.
Overview
This section describes the overall statistics of your data, such as record count and data range.

Field summary
This section describes the basic statistics of each your feature. The inferred variable type is provided as a reference for mapping variables in your data to a list of Amazon Fraud Detector predefined variable types. The inferred variable type is based on data statistics. We recommend choosing variable types based on your own domain knowledge wherever possible, and refer to the suggested variable type if you’re unsure.

Field warnings
This section shows the warning messages from basic data validation of Amazon Fraud Detector, including number of unique values and number of missing values. You can refer to Amazon Fraud Detector troubleshoot for suggested solutions.

Data and label maturity
This section shows the fraud distribution of your data over time. The chart is interactive (see the following screenshot for an example): scrolling the pointer over the plot allows you to zoom in or out; dragging the plot left or right changes the x-axis ranges; and toggling the legend can hide or show corresponding bars or curves. You can click Reset zoom to reset the chart.
You should check that there is enough time for label maturity. The maturity period is dependent on your business, and can take anywhere from 2 weeks to 90 days. For example, if your label maturity is 30 days, make sure that the latest records in your dataset are at least 30 days old.
You should also check that the label distribution is relatively stable over time. Make sure that events of different label classes are from the same time period.
Categorical feature analysis
This section shows the label distribution across categories for each categorical feature. You can see the number of records of each label class within a category and corresponding percentages. By default, it displays the top 100 categories, and you can drag the plot and scroll to see up to 500 categories in total.
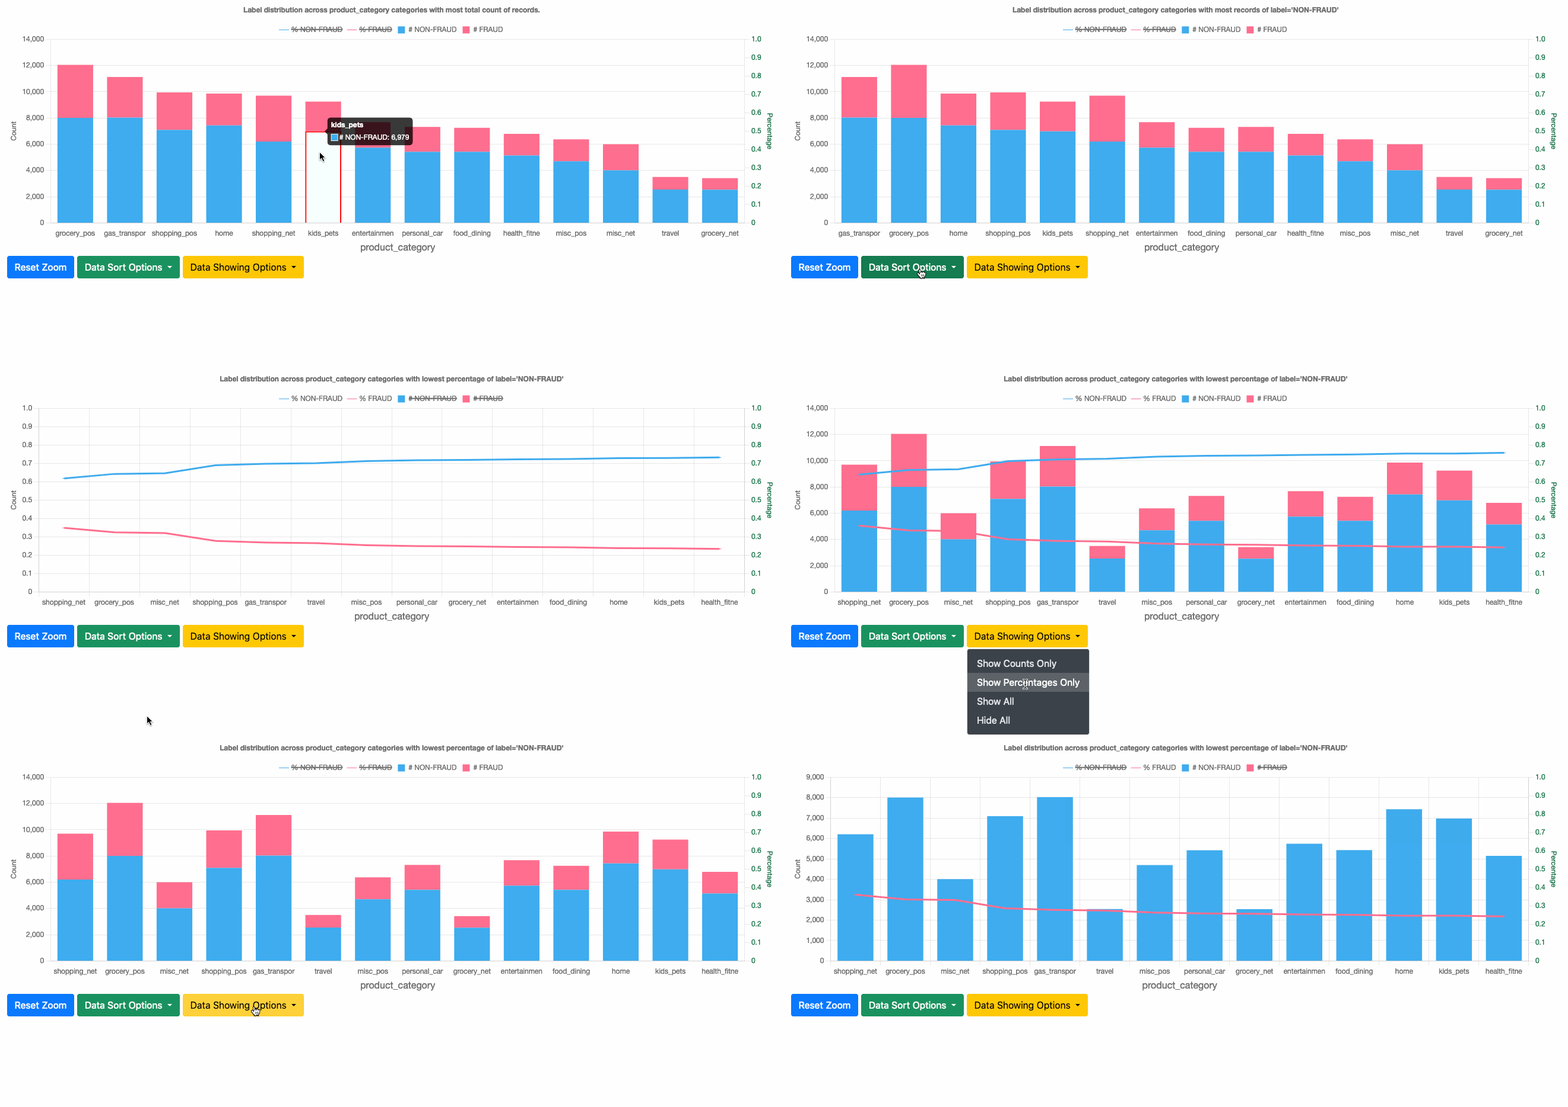
You can choose from several sorting options to use the one that best fits your needs:
- Sort by most records – Shows the categories with the most records, which reflects the general distribution of categories.
- Sort by most records of label=NON-FRAUD – Shows the categories with the most records of the NON-FRAUD class. Those categories contribute to most legitimate population.
- Sort by most records of label≠NON-FRAUD – Shows the categories with the most records of the FRAUD class. Those categories contribute to most fraud population.
- Sort by lowest percentage of label=NON-FRAUD – Shows the categories with the highest FRAUD rate, which are the risky categories.
You can choose which data to plot on the Data Showing Options menu. Toggling the legends can also show or hide the corresponding bars or curves.
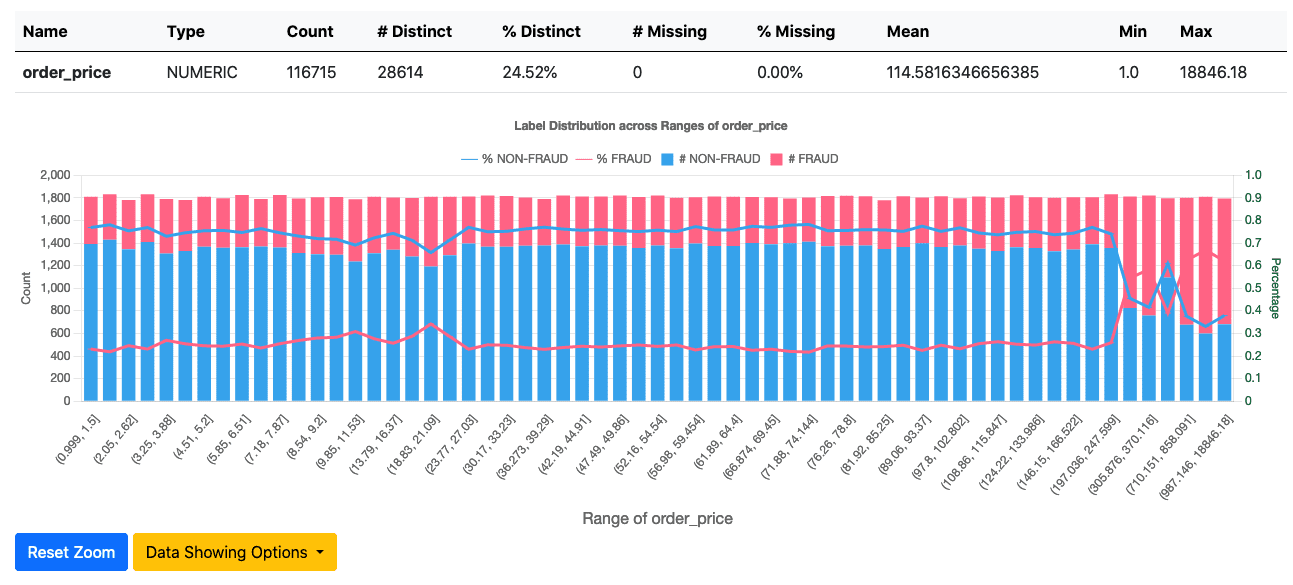
Numeric feature analysis
This section shows the label distribution of each numeric feature. The numerical values are partitioned into bins, and you can see the number of records of each label class, as well as percentage, within each bin.
Feature and label correlation
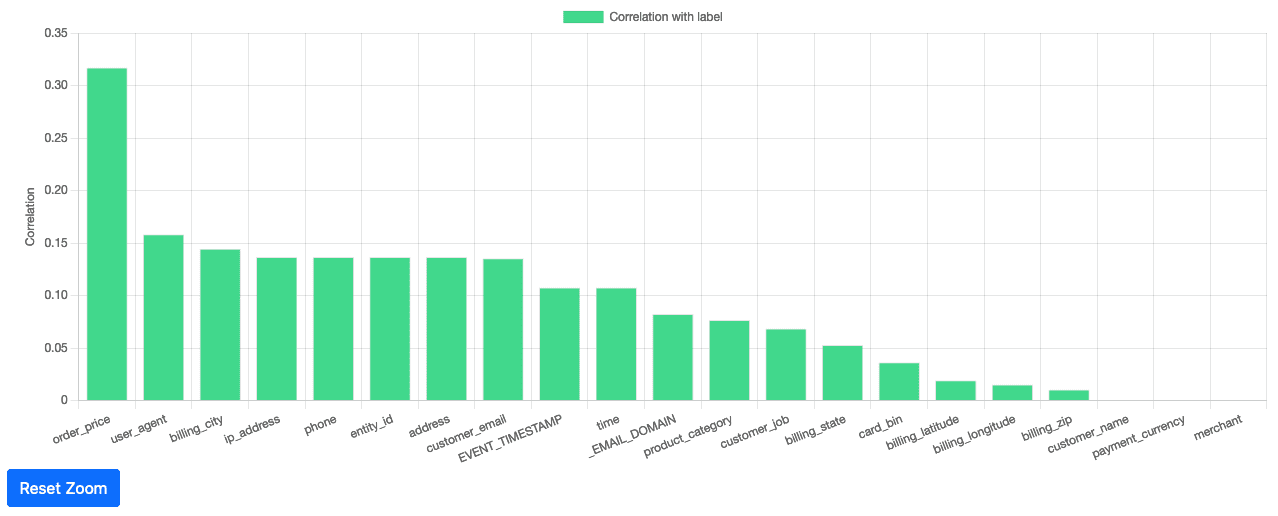
This section shows the correlation between each feature and the label in one plot. You can combine this correlation plot with the model variable importance values generated by Amazon Fraud Detector after model training to identify potential label leakage. For example, if a feature has over 0.99 correlation with label and it has significantly higher variable importance than other features, there’s a risk of label leakage on that feature. Label leakage happens when the label is fully dependent on one feature. As a result, the model is heavily overfitted on that feature and doesn’t learn the actual fraud pattern. Features with label leakage should be excluded in model training.
The following plot shows an example of correlation between features and EVENT_LABEL.
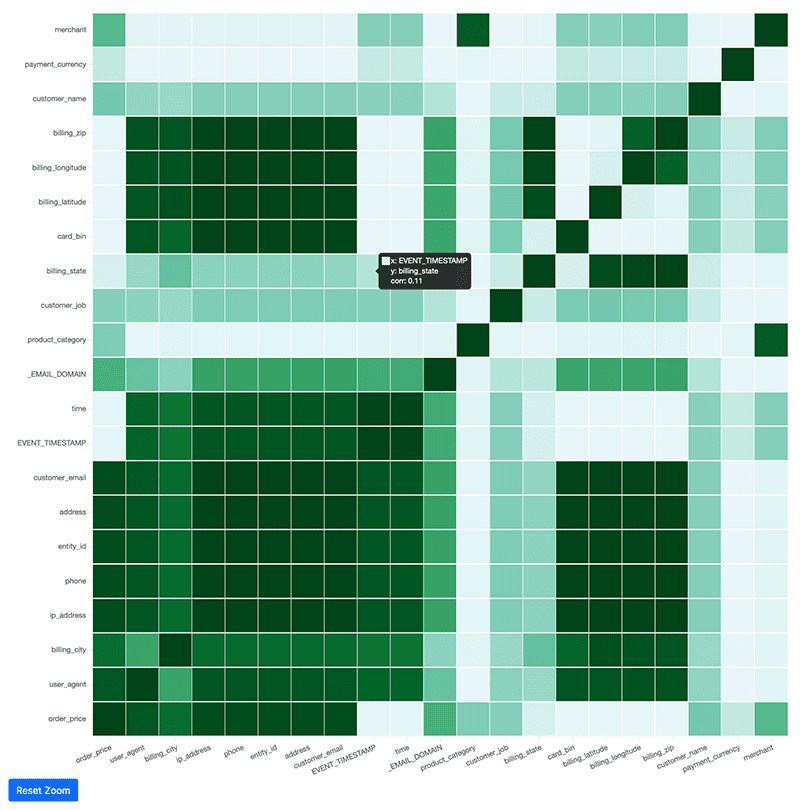
If FeatureCorr is set to Yes in the CloudFormation stack configuration, you have a second plot showing pair-wise feature correlations. Darker colors indicate higher correlation. For features with high correlation, you should double-check if that is expected in your business. If two features have a correlation equal to 1, you can consider removing either of them to reduce model complexity. However, this isn’t required because Amazon Fraud Detector model is robust to feature collinearity.
Data cleaning
The data profiler also has an option to convert your CSV file to comply with the data format requirements of Amazon Fraud Detector:
- Header name transformation – Transforms the event timestamp and label column headers to
EVENT_TIMESTAMPandEVENT_LABEL. All other headers are converted to lowercase alphanumeric with only _ as a special character. Make sure when you create an event type, the variables are defined as those transformed values. - Timestamp transformation – Transforms the
EVENT_TIMESTAMPcolumn to ISO 8601 standard in UTC. - Event label transformation – Converts your label values to all lowercase alphanumeric with only _ as a special character. Make sure when you create an event type, the labels are defined as those transformed values.
The following screenshots compare original data to formatted data, where DropTimestampMissingRows and DropLabelMissingRows are set to Yes.
Clean up the resources
You can use AWS CloudFormation to clean up all the resources created for data profiler.
- On the AWS CloudFormation console, choose Stacks in the navigation pane.
- Select the CloudFormation stack and choose Delete.

All the resources, including IAM roles, AWS Glue job, and Lambda function, are removed. Note that the profiling report and reformatted data are not deleted.
Conclusion
This post walks through the automated data profiler and cleaner for Amazon Fraud Detector. This is a convenient and useful tool for preparing your data for Amazon Fraud Detector. The next steps are to build an end-to-end fraud detector via the Amazon Fraud Detector console. For more information, see the Amazon Fraud Detector User Guide and related blog posts.
About the Authors
 Hao Zhou is a Research Scientist with Amazon Fraud Detector. He holds a PhD in electrical engineering from Northwestern University, USA. He is passionate about applying machine learning techniques to combat fraud and abuse.
 Anqi Cheng is a research scientist in Amazon Fraud Detector (AFD) team. She holds a Ph.D. in physics and joined Amazon in 2017. She has been actively working on various aspects of AFD since its very early days from exploring start-of-art machine learning algorithms, productionizing machine learning workflow, and improving the robustness and explainability of machine learning models.
Tags: Archive



Leave a Reply