Why the Knowledge Management culture may not be as bad as you think
I did some calculations recently that suggest that attempts to measure a corporate KM culture may give pessimistic figures. Here’s why.
We all know that culture is a key factor in KM, and that introducing KM will involve some culture change. Also we know (and ISO 30401 reminds us) that one way to prepare for the culture change is to measure the current culture as it affects KM, define the desired culture, and look at what drives the gap between the two.
However a recent article from Hofstede Insights entitled “Organizational culture, what you need to know” sparked something in my brain, when I read about the different types of culture. There are the current culture and the future desired culture, but there is also the perceived culture. The latter is the organisational culture that the people think the organisation has. So if we measure culture, are we measuring actual, or perceived?
Here is one way we can maybe start to untangle the two.
Knoco has run a survey-based KM culture tool for many years. We measure the culture along 10 dimensions, and we do the measurement by asking people to indicate their level of agreement with a series of statements. For example, if people strongly agree with the statement “I don’t like to talk about mistakes and failures at work”, then you might assume a challenge with the cultural dimension of Openness. Or if they strongly disagree with the statement “Bad news is always adjusted in order to seem better” you might assume there is little problem with the cultural dimension of Honesty. The output of the survey is a line plot or spider plot that provides a snapshot of the culture, allows identification of the main challenges, and provides a benchmark to measure progress.
The survey contains some positive questions, where agreement is a good thing, and some negative questions, where disagreement is a good thing. It also contains some personal statements about the individual (“I don’t like to talk about mistakes and failures at work”) and some general statements about the organization (“Bad news is always adjusted in order to seem better”).
One effect I have noted for a long time is that the answers about the individual are always more positive than general answers about the organisation. I initially thought that this was a personal halo effect, but in fact it may represent the difference between actual and perceived culture.
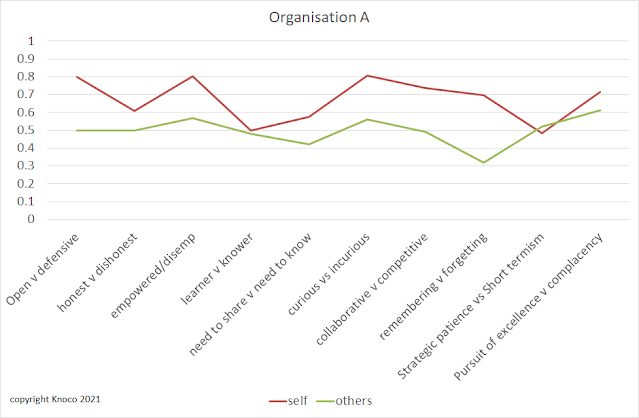
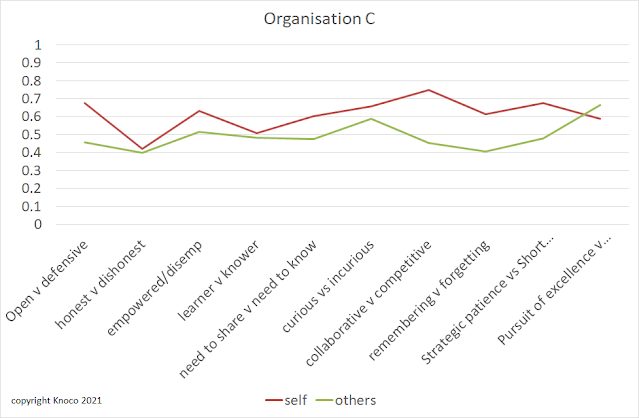
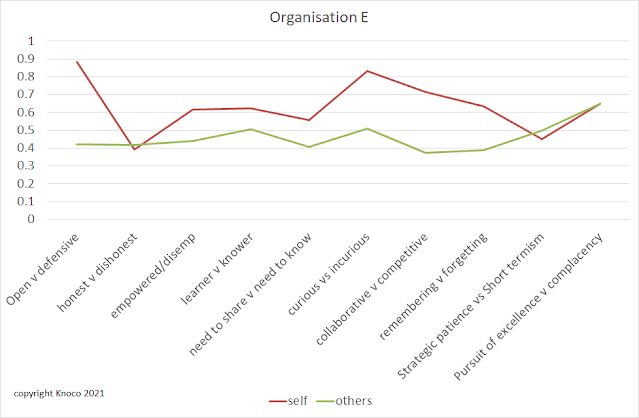
Take a look at the three plots below, from three different organisations.
In each case there are two lines – a red line, where people responded to statements about their own attitudes and behaviours (“I” statements”), and a green line, where they answered about the organisation (“We” statements, or “People” or “Leaders”). A higher score means a more KM-friendly culture, where respondents strongly agree with positive statements and strongly disagree with negative statements.
For the vast majority of data points, the red line is higher than the green.
Now this result could be an artefact, where the personal questions are far easier to agree with than the general questions, but we tried to avoid this when setting the questions.
Alternatively it could be a real result, where people honestly think the organisational attitudes and behaviours are worse than their own attitudes and behaviours, where KM is concerned.
Again this could be an artefact of the sampling, for example sampling people who are happy to answer a survey, people with a KM background, or people who are attending a KM course at which they answer a survey. Maybe we just sampled a non-representative group.
Alternatively it could be the difference between real culture and perceived culture. If we assume people know their own minds, then the red lines above – the responses to the personal statements – could reflect the real culture. The green lines could be the people’s perception of the organisational culture as a whole, and it could be a distorted perception. It could be that if EVERYONE took they survey, that would ALL say that they were fairly open and honest, but that the organisation as a whole wasn’t. That would reflect a difference between reality, and perception.
The patterns shown above are so common that I wonder if this latter explanation is the real case, and that people honestly perceive the organisational culture as being worse than it actually is. If this is true, then this is good news. We can say to people “You know how open and honest you are, willing to share knowledge and learn from others? Actually, most people in the organisation feel the same way! Don’t be held back by a perception of how they will react, or what they might say. They are on your side! Go ahead, share your knowledge, learn from your peers, take time for learning, be open, be honest, be curious, collaborate”.
Then if this happens, and and people find there is no criticism or challenge, then the culture will change as will the perception of the culture, and in future surveys we might find the green line rising to meet the red, or even both lines rising in tandem.
The survey data show a difference between people’s views of their own culture, and their perception of the organisational culture as a whole, with the latter consistently poorer than the former. It could well be the case therefore that the perceived culture looks worse than it actually is.
Tags: Archive


Leave a Reply