Create random and stratified samples of data with Amazon SageMaker Data Wrangler
In this post, we walk you through two sampling techniques in Amazon SageMaker Data Wrangler so you can quickly create processing workflows for your data. We cover both random sampling and stratified sampling techniques to help you sample your data based on your specific requirements.
Data Wrangler reduces the time it takes to aggregate and prepare data for machine learning (ML) from weeks to minutes. You can simplify the process of data preparation and feature engineering, and complete each step of the data preparation workflow, including data selection, cleansing, exploration, and visualization, from a single visual interface. With Data Wrangler’s data selection tool, you can choose the data you want from various data sources and import it with a single click. Data Wrangler contains over 300 built-in data transformations so you can quickly normalize, transform, and combine features without having to write any code. With Data Wrangler’s visualization templates, you can quickly preview and inspect that these transformations are completed as you intended by viewing them in Amazon SageMaker Studio, the first fully integrated development environment (IDE) for ML. After your data is prepared, you can build fully automated ML workflows with Amazon SageMaker Pipelines and save them for reuse in Amazon SageMaker Feature Store.
What is sampling and how can it help
In statistical analysis, the total set of observations is known as the population. When working with data, it’s often not computationally feasible to measure every observation from the population. Statistical sampling is a procedure that allows you to understand your data by selecting subsets from the population.
Sampling offers a practical solution that sacrifices some accuracy for the sake of practicality and ease. To ensure your sample is a good representation of overall population, you can employ sampling strategies. Data Wrangler supports two of the most common strategies: random sampling and stratified sampling.
Random sampling
If you have a large dataset, experimentation on that dataset may be time-consuming. Data Wrangler provides random sampling so you can efficiently process and visualize your data. For example, you may want to compute the average number of purchases for a customer within a time frame, or you may want to compute the attrition rate of a subscriber. You can use a random sample to visualize approximations to these metrics.
A random sample from your dataset is chosen so that each element has an equal probability of being selected. This operation is performed in an efficient manner suitable for large datasets, so the sample size returned is approximately the size requested, and not necessarily equal to the size requested.
You can use random sampling if you want to do quick approximate calculations to understand your dataset. As the sample size gets larger, the random sample can better approximate the entire dataset, but unless you include all data points, your random sample may not include all outliers and edge cases. If you want to prepare your entire dataset interactively, you can also switch to a larger instance type.
As a general rule, the sampling error in computing the population mean using a random sample tends to 0 as the sample gets larger. As the sample size increases, the error decreases as the inverse of the square root of the sample size. The takeaway being, the larger the sample, the better the approximation.
Stratified sampling
In some cases, your population can be divided into strata, or mutually exclusive buckets, such as geographic location for addresses, publication year for songs, or tax brackets for incomes. Random sampling is the most popular sampling technique, but if some strata are uncommon in your population, you can use stratified sampling in Data Wrangler to ensure that each strata is proportionally represented in your sample. This may be useful to reduce sampling errors as well as to ensure you’re capturing edge cases during your experimentation.
In the real world, fraudulent credit card transactions are rare events and typically make up less than 1% of your data. If we were to sample randomly, it’s not uncommon for the sample to contain very few or no fraudulent transactions. As a result, when training a model, we would have too few fraudulent examples to learn an accurate model. We can use stratified sampling to make sure we have proportional representation of fraudulent transactions.
In stratified sampling, the size of each strata in the sample is proportional to the size of the strata in the population. This works by dividing your data into strata based on your specified column, selecting random samples from each strata with the correct proportion, and combining those samples into a stratified sample of the population.
Stratified sampling is a useful technique when you want to understand how different groups in your data compare with each other, and you want to ensure you have appropriate representation from each group.
Random sampling when importing from Amazon S3
In this section, we use random sampling with a dataset consisting of both fraudulent and non-fraudulent events from our fraud detection system. You can download the dataset to follow along with this post (CC 4.0 international attribution license).
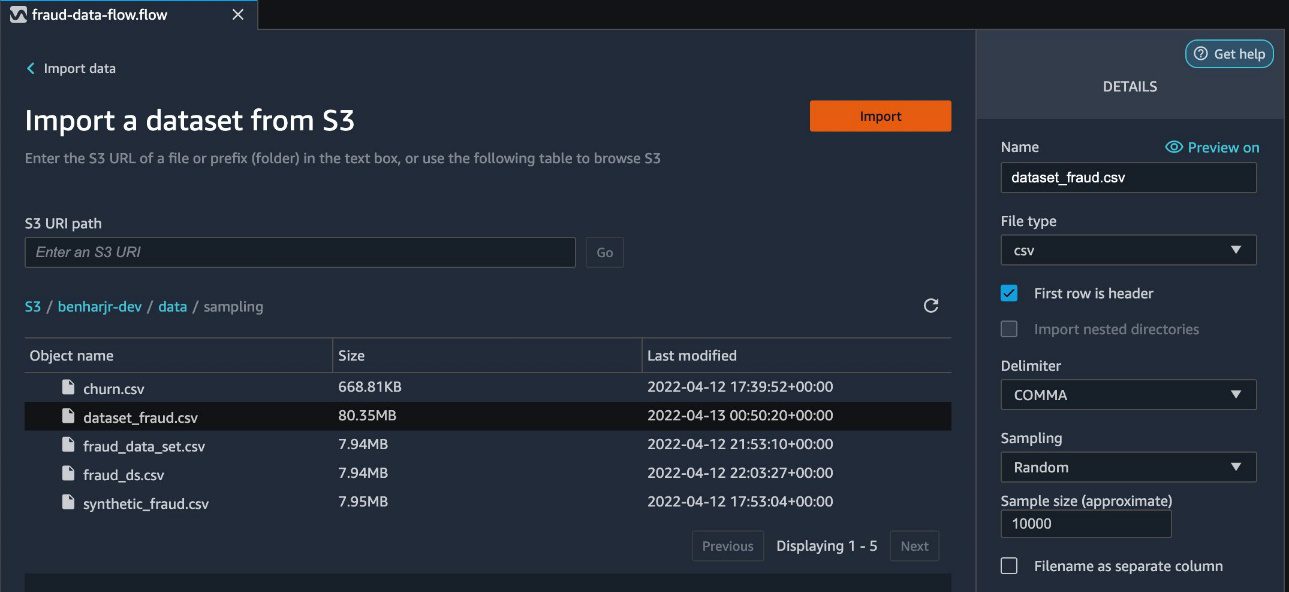
At the time of this writing, you can import datasets from Amazon Simple Storage Service (Amazon S3), Amazon Athena, Amazon Redshift, and Snowflake. Our dataset is very large, containing 1 million rows. In this case, we want to sample 1,0000 rows on import from Amazon S3 for some interactive experimentation within Data Wrangler.
- Open SageMaker Studio and create a new Data Wrangler flow.
- Under Import data, choose Amazon S3.

- Choose the dataset to import.
- In the Details pane, provide your dataset name and file type.
- For Sampling, choose Random.
- For Sample size, enter
10000. - Choose Import to load the dataset into Data Wrangler.

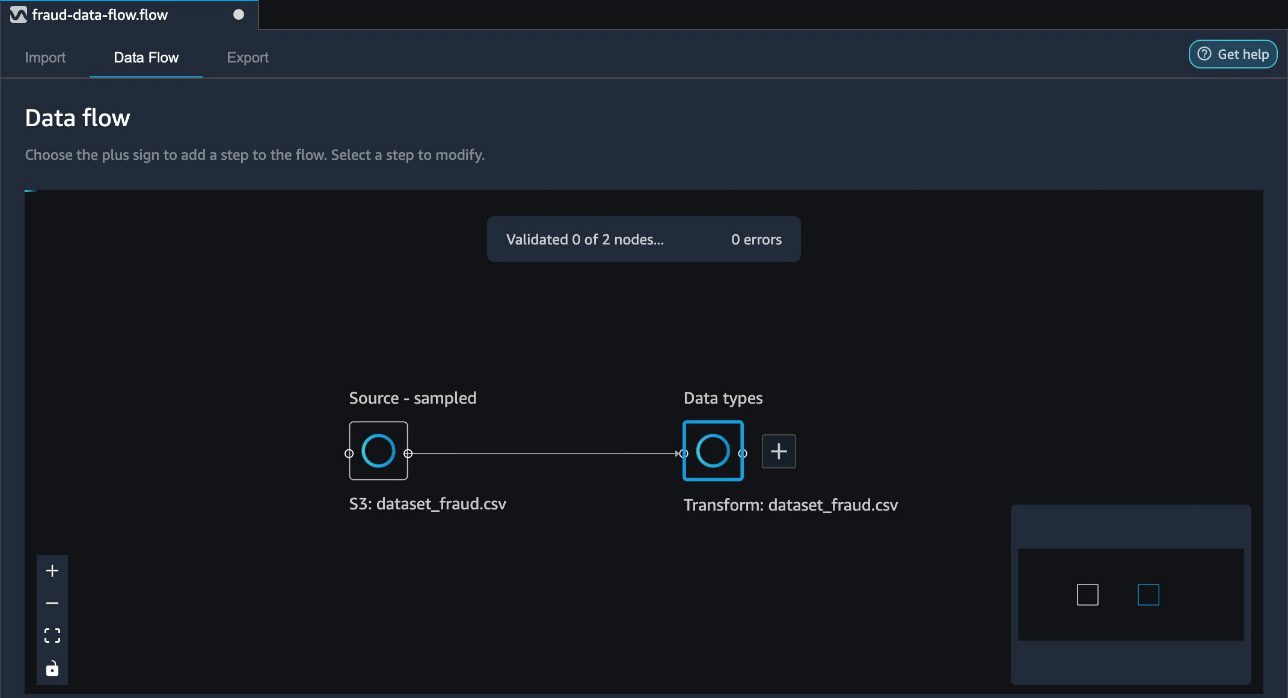
You can visualize two distinct steps on the data flow page in Data Wrangler. The first step indicates the loading of the sample dataset based on the sampling strategy you defined. After the data is loaded, Data Wrangler performs auto detection of the data types for each of the columns in the dataset. This step is added by default for all datasets.
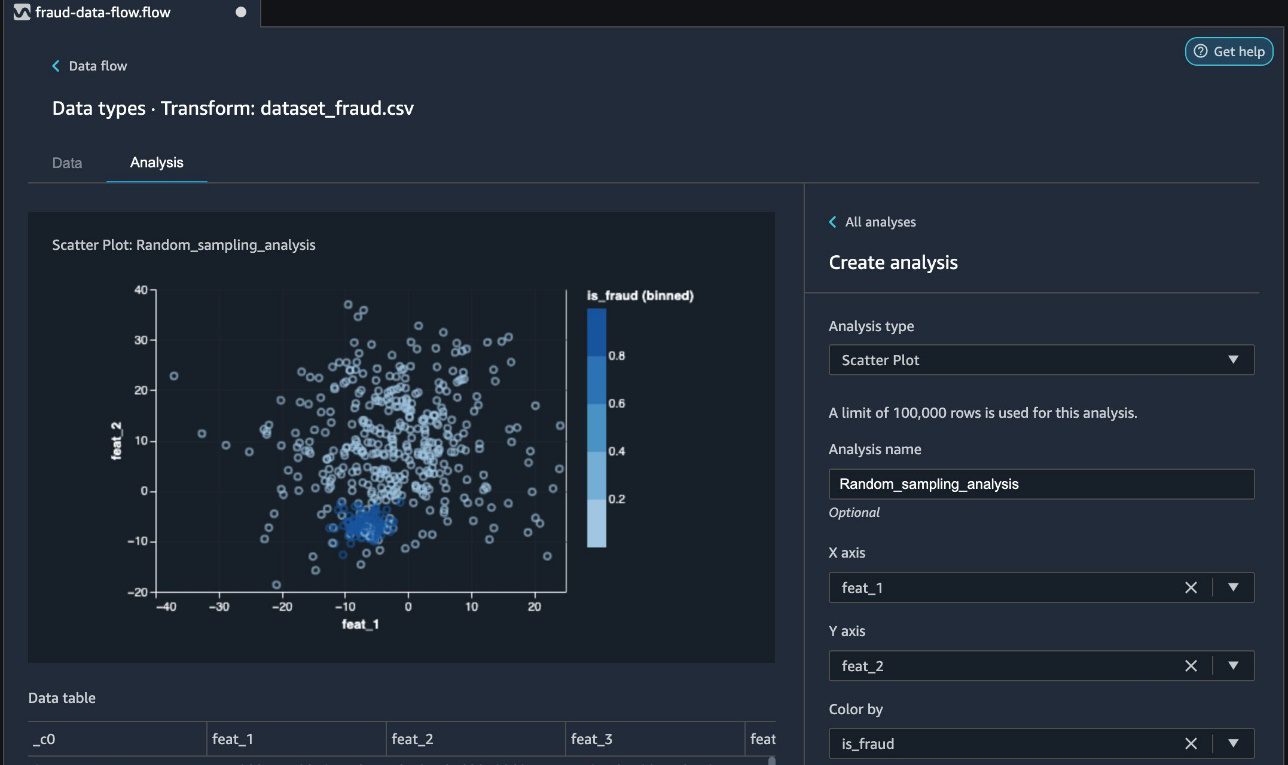
You can now review the random sampled data in Data Wrangler by adding an analysis.
- Choose the plus sign next to Data types and choose Analysis.

- For Analysis type¸ choose Scatter Plot.
- Choose feat_1 and feat_2 as for X axis and Y axis, respectively.
- For Color by, choose is_fraud.
When you’re comfortable with the dataset, proceed to do further data transformations as per your business requirement to prepare your data for ML.
In the following screenshot, we can observe the fraudulent (dark blue) and non-fraudulent (light blue) transactions in our analysis.
In the next section, we discuss using stratified sampling to ensure the fraudulent cases are chosen proportionally.
Stratified sampling with a transform
Data Wrangler allows you to sample on import, as well as sampling via a transform. In this section, we discuss using stratified sampling via a transform after you have imported your dataset into Data Wrangler.
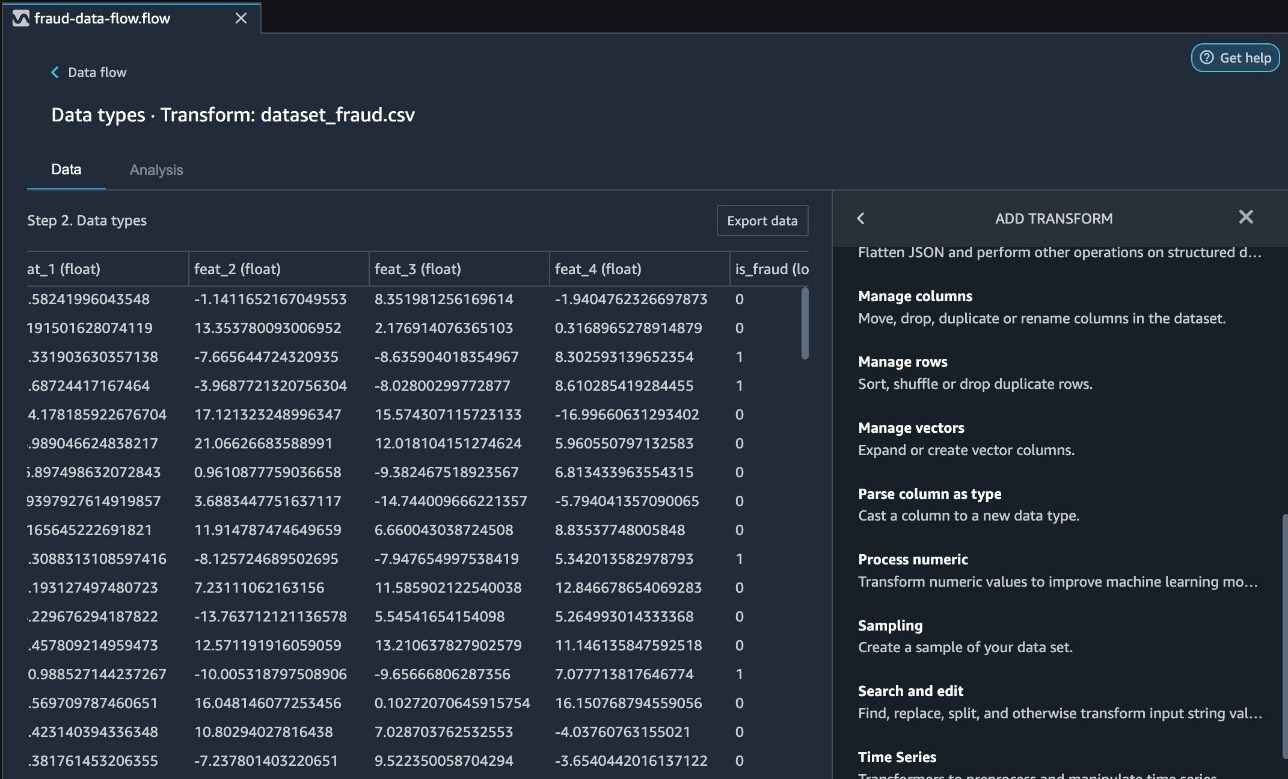
- To initiate sampling, on the Data Flow tab, choose the plus sign next to the imported dataset and choose Add Transform.

At the time of this writing, Data Wrangler provides more than 300 built-in transformations. In addition to the built-in transforms, you can write your own custom transforms in Pandas or PySpark.
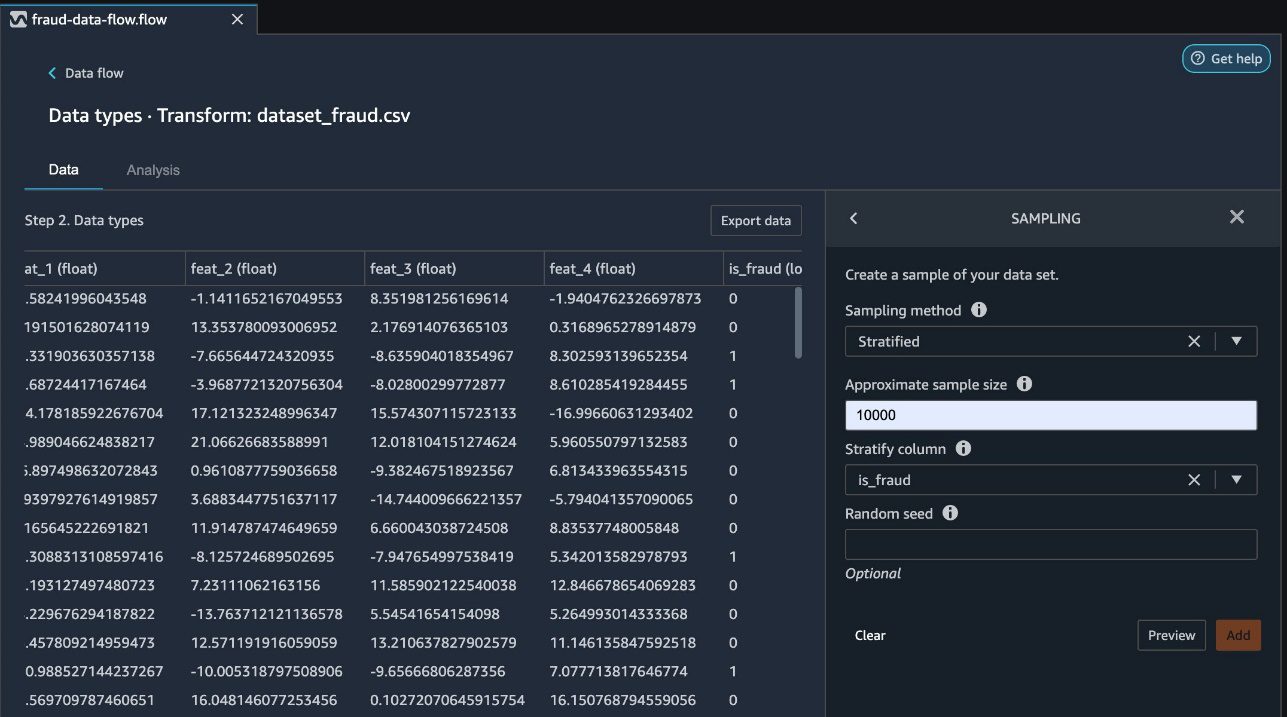
You can now use three distinct sampling strategies: limit, random, and stratified.
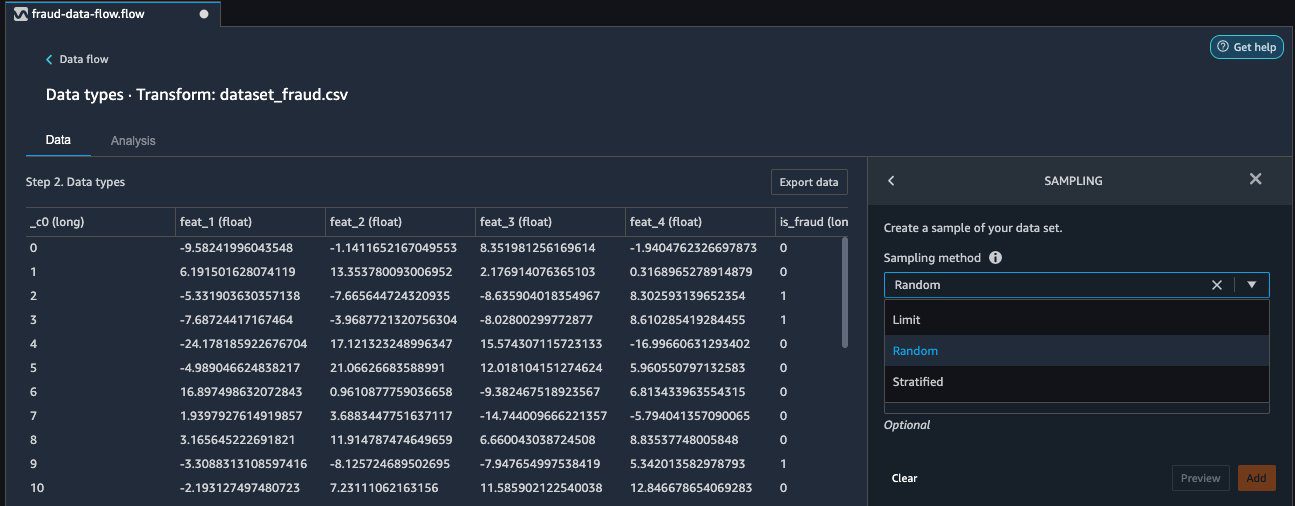
- For Sampling method, choose Stratified.
- Use the
is_fraudcolumn as the stratify column. - Choose Preview to preview the transformation, then choose Add to add this transformation as a step to your transformation recipe.

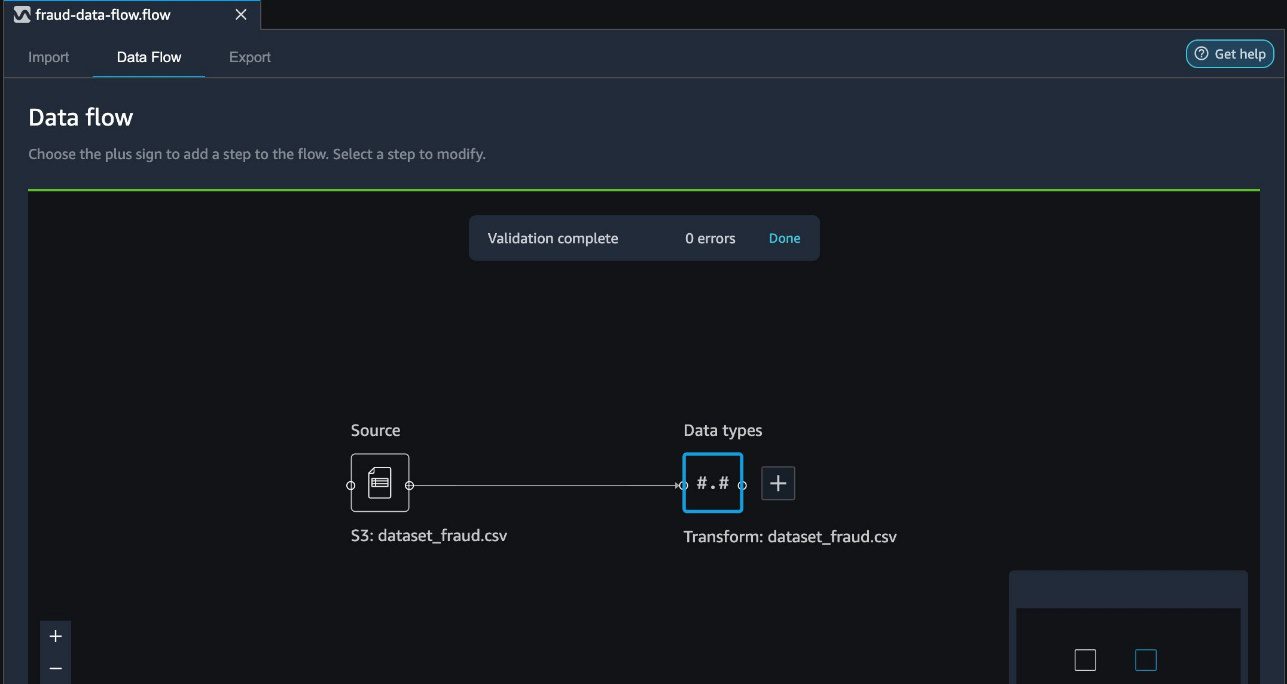
Your data flow now reflects the added sampling step.
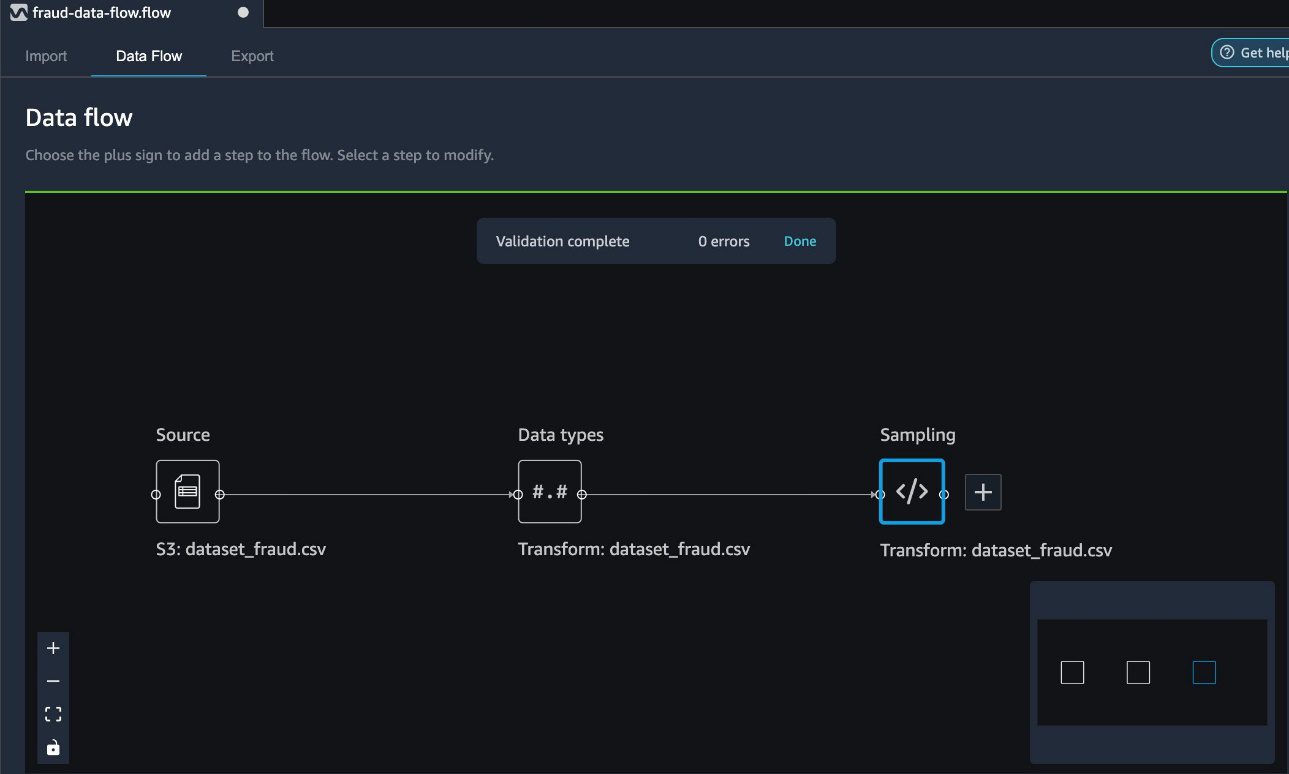
Now we can review the random sampled data by adding an analysis.
- Choose the plus sign and choose Analysis.
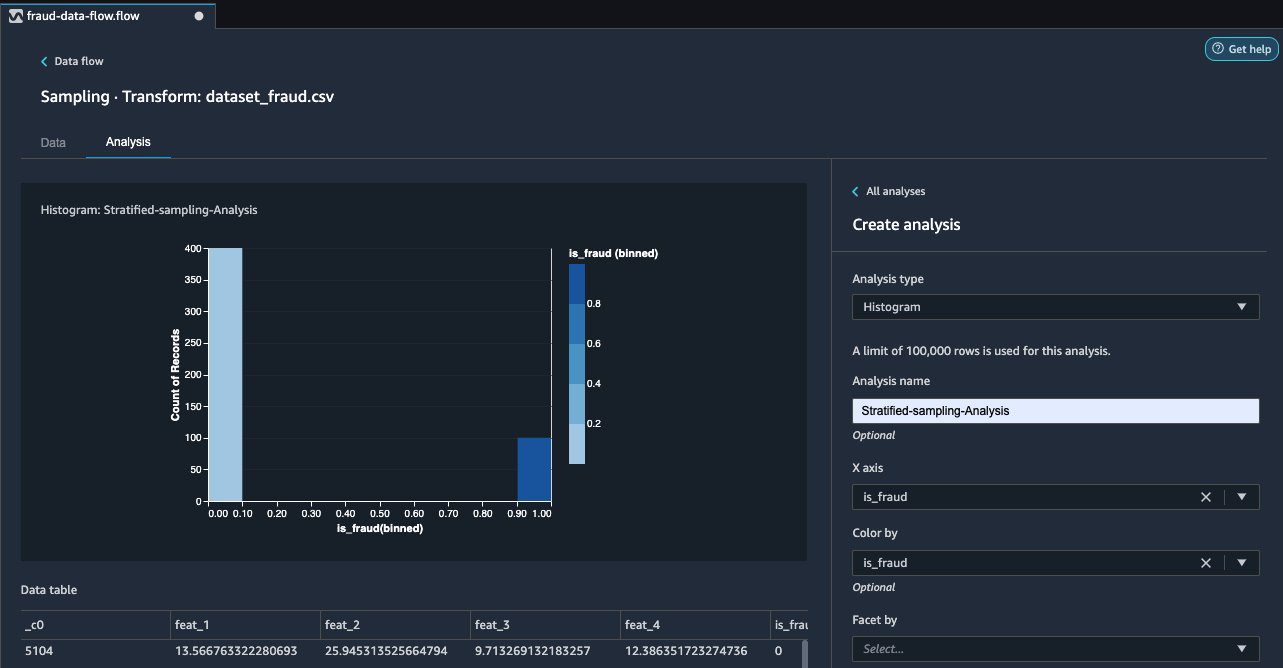
- For Analysis type¸ choose Histogram.
- Choose is_fraud for both X axis and Color by.
- Choose Preview.
In the following screenshot, we can observe the breakdown of fraudulent (dark blue) and non-fraudulent (light blue) cases chosen via stratified sampling in the correct proportions of 20% fraudulent and 80% non-fraudulent.
Conclusion
It is essential to sample data correctly when working with extremely large datasets and to choose the right sampling strategy to meet your business requirements. The effectiveness of your sampling relies on various factors, including business outcome, data availability, and distribution. In this post, we covered how to use Data Wrangler and its built-in sampling strategies to prepare your data.
You can start using this capability today in all Regions where SageMaker Studio is available. To get started, visit Prepare ML Data with Amazon SageMaker Data Wrangler.
Acknowledgements
The authors would like to thank Jonathan Chung (Applied Scientist) for his review and valuable feedback on this article.
About the Authors
 Ben Harris is a software engineer with experience designing, deploying, and maintaining scalable data pipelines and machine learning solutions across a variety of domains.
 Vishaal Kapoor is a Senior Applied Scientist with AWS AI. He is passionate about helping customers understand their data in Data Wrangler. In his spare time, he mountain bikes, snowboards, and spends time with his family.
 Meenakshisundaram Thandavarayan is a Senior AI/ML specialist with AWS. He helps Hi-Tech strategic accounts on their AI and ML journey. He is very passionate about data-driven AI.
 Ajai Sharma is a Principal Product Manager for Amazon SageMaker where he focuses on Data Wrangler, a visual data preparation tool for data scientists. Prior to AWS, Ajai was a Data Science Expert at McKinsey and Company, where he led ML-focused engagements for leading finance and insurance firms worldwide. Ajai is passionate about data science and loves to explore the latest algorithms and machine learning techniques.
Tags: Archive

Leave a Reply