Amazon Forecast now supports accuracy measurements for individual items
We’re excited to announce that you can now measure the accuracy of forecasts for individual items in Amazon Forecast, allowing you to better understand your forecasting model’s performance for the items that most impact your business. Improving forecast accuracy for specific items—such as those with higher prices or higher costs—is often more important than optimizing for all items. With this launch, you can now view accuracy for individual items and export forecasts generated during training. This information allows you to better interpret results by easily comparing performance against observed historical demand, aggregating accuracy metrics across custom sets of SKUs or time periods, or visualizing results without needing to hold out a separate validation dataset. From there, you can tailor your experiments to further optimize accuracy for items significant for your needs.
If a smaller set of items is more important for your business, achieving a high forecasting accuracy for those items is imperative. For retailers specifically, not all SKUs are treated equally. Usually 80% of revenue is driven by 20% of SKUs, and retailers look to optimize forecasting accuracy for those top 20% SKUs. Although you can create a separate forecasting model for the top 20% SKUs, the model’s ability to learn from relevant items outside of the top 20% is limited and accuracy may suffer. For example, a bookstore company looking to increase forecasting accuracy of best sellers can create a separate model for best sellers, but without the ability to learn from other books in the same genre, the accuracy for new best sellers might be poor. Evaluating how the model, which is trained on all the SKUs, performs against those top 20% SKUs provides more meaningful insights on how a better forecasting model can have a direct impact on business objectives.
You may instead look to optimize your forecasting models for specific departments. For example, for an electronic manufacturer, the departments selling the primary products may be more important than the departments selling accessory products, encouraging the manufacturer to optimize accuracy for those departments. Furthermore, the risk tolerance for certain SKUs might be higher than others. For long shelf life items, you may prefer to overstock because you can easily store excess inventory. For items with a short shelf life, you may prefer a lower stocking level to reduce waste. It’s ideal to train one model but assess forecasting accuracy for different SKUs at different stocking levels.
To evaluate forecasting accuracy at an item level or department level, you usually hold a validation dataset outside of Forecast and feed your training dataset to Forecast to create an optimized model. After the model is trained, you can generate multiple forecasts and compare those to the validation dataset, incurring costs during this experimentation phase, and reducing the amount of data that Forecast has to learn from.
Shivaprasad KT, Founder and CEO of Ganit, an analytics solution provider, says, “We work with customers across various domains of consumer goods, retail, hospitality, and finance on their forecasting needs. Across these industries, we see that for most customers, a small segment of SKUs drive most of their business, and optimizing the model for those SKUs is more critical than overall model accuracy. With Amazon Forecast launching the capability to measure forecast accuracy at each item, we are able to quickly evaluate the different models and provide a forecasting solution to our customers faster. This helps us focus more on helping customers with their business operation analysis and less on the manual and more cost-prohibitive tasks of generating forecasts and calculating item accuracy by ourselves. With this launch, our customers are able to experiment faster incurring low costs with Amazon Forecast.”
With today’s launch, you can now access the forecasted values from Forecast’s internal testing of splitting the data into training and backtest data groups to compare forecasts versus observed data and item-level accuracy metrics. This eliminates the need to maintain a holdout test dataset outside of Forecast. During the step of training a model, Forecast automatically splits the historical demand datasets into a training and backtesting dataset group. Forecast trains a model on the training dataset and forecasts at different specified stocking levels for the backtesting period, comparing to the observed values in the backtesting dataset group.
You can also now export the forecasts from the backtesting for each item and the accuracy metrics for each item. To evaluate the strength of your forecasting model for specific items or a custom set of items based on category, you can calculate the accuracy metrics by aggregating the backtest forecast results for those items.
You may group your items by department, sales velocity, or time periods. If you select different stocking levels, you can choose to assess the accuracy of certain items at certain stocking levels, while measuring accuracy of other items at different stocking levels.
Lastly, now you can easily visualize the forecasts compared to your historical demand by exporting the backtest forecasts to Amazon QuickSight or any other visualization tool of your preference.
Forecast provides different model accuracy metrics for you to assess the strength of your forecasting models. We provide the weighted quantile loss (wQL) metric for each selected distribution point, and weighted absolute percentage error (WAPE) and root mean square error (RMSE), calculated at the mean forecast. For more information about how each metric is calculated and recommendations for the best use case for each metric, see Measuring forecast model accuracy to optimize your business objectives with Amazon Forecast.
Although Forecast provides these three industry-leading forecast accuracy measures, you might prefer to calculate accuracy using different metrics. With the launch of this feature, you can use the export of forecasts from backtesting to calculate the model accuracy using your own formula, without the need to generate forecasts and incur additional cost during experimentation.
After you experiment and finalize a forecasting model that works for you, you can continue to generate forecasts on a regular basis using the CreateForecast API.
Exporting forecasts from backtesting and accuracy metrics for each item
To use this new capability, use the newly launched CreatePredictorBacktestExportJob API after training a predictor. In this section, we walk through the steps on the Forecast console using the Bike Sharing dataset example in our GitHub repo. You can also refer to this notebook in our GitHub repo to follow through these steps using the Forecast APIs.
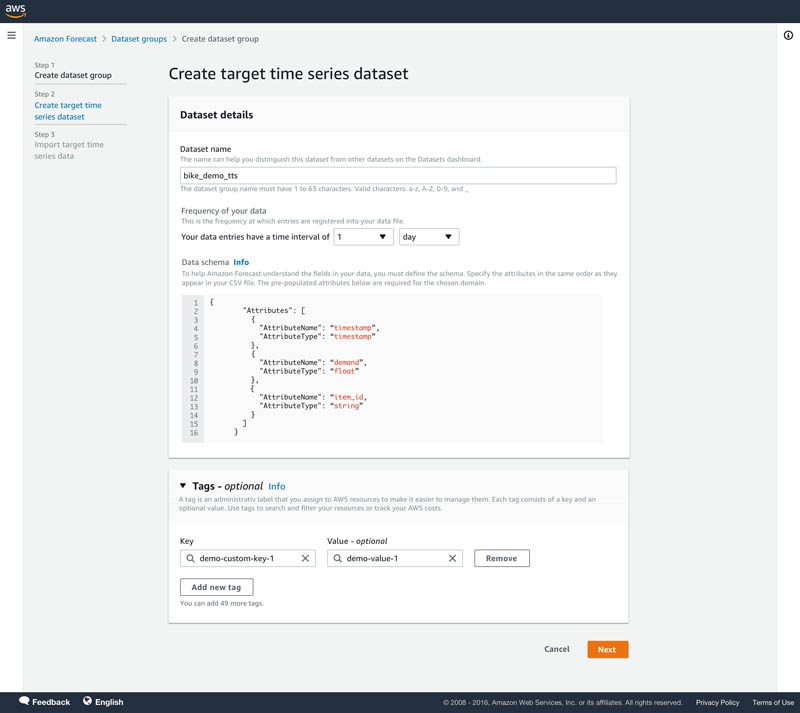
The bike sharing dataset forecasts the number of bike rides expected in a location. There are more than 400 locations in the dataset.
- On the Forecast console, create a dataset group.
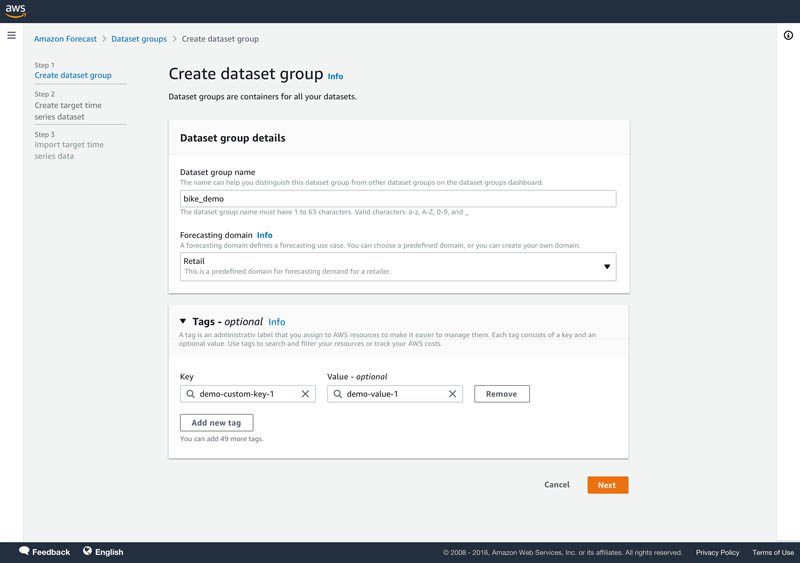
- Upload the target time series file from the bike dataset.
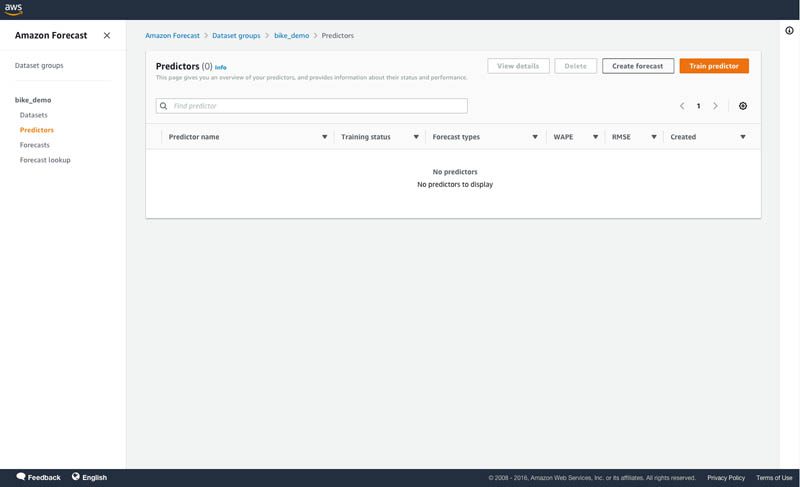
- In the navigation pane, choose Predictors.
- Choose Train predictor.
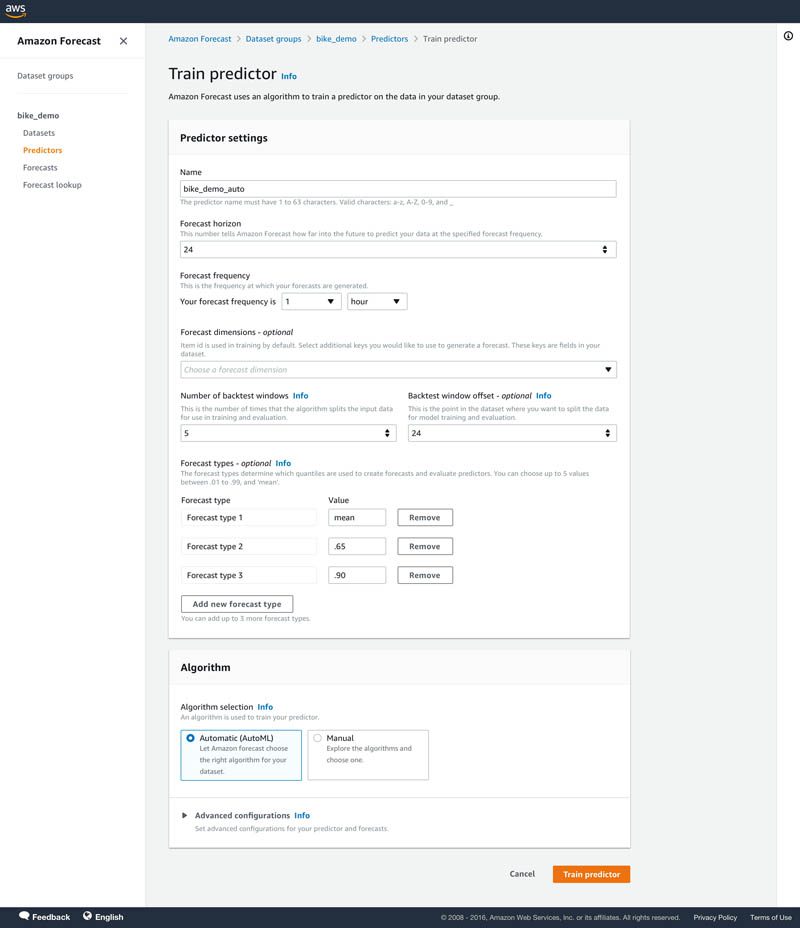
- For training a predictor, we use the following configuration:
-
- For Forecast horizon, choose 24.
- For Forecast frequency, set to hourly.
- For Number of backtest windows, choose 5.
- For Backtest window offset, choose 24.
- For Forecast types, enter mean, 65, and 0.90.
- For Algorithm, select Automatic (AutoML).
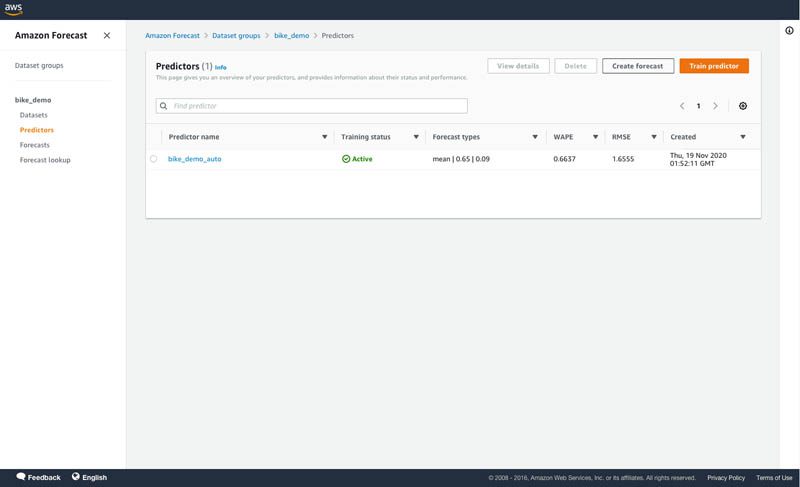
- After your predictor is trained, choose your predictor on the Predictors page to view details of the accuracy metrics.
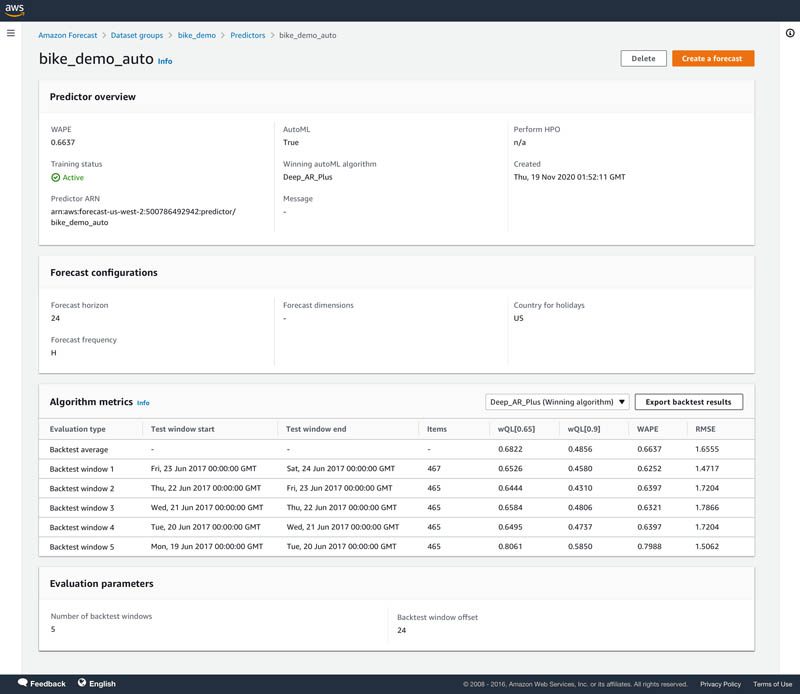
- On the predictor’s details page, choose Export backtest results in the Predictor metrics
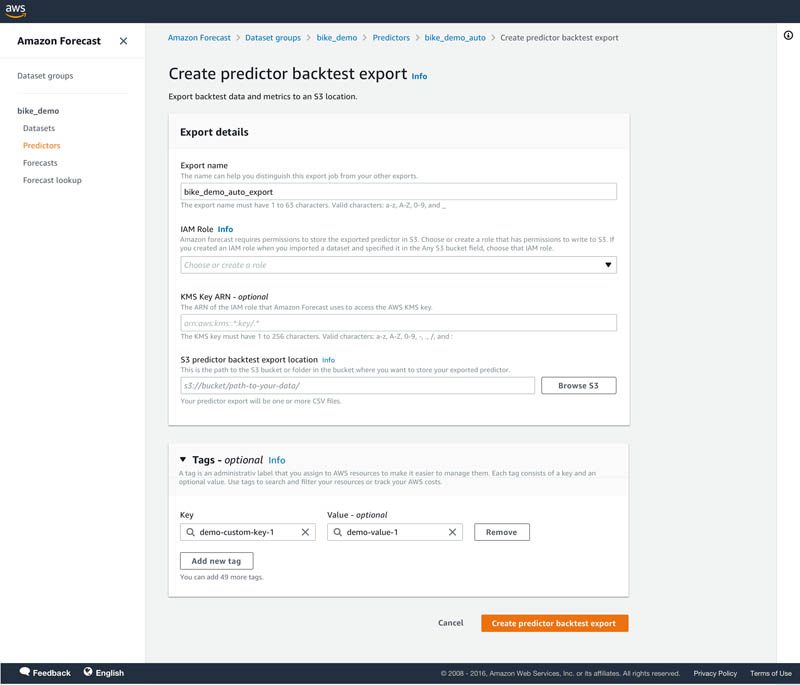
- For S3 predictor backtest export location, enter the details of your Amazon Simple Storage Service (Amazon S3) location for exporting the CSV files.
Two type of files are exported to the Amazon S3 location in two different folders:
- forecasted-values – Contains the forecasts from each backtest window. The file name convention is
Forecasts_PredictorBacktestExportJobName_CurrentTimestamp_PartNumber.csv. For this post, the file name isForecasts_bike_demo_auto_export_2020-11-19-00Z_part0.csv. - accuracy-metrics-values – Contains the accuracy metrics for each item per backtest window. The file name convention is
Accuracy_ PredictorBacktestExportJobName_CurrentTimestamp_PartNumber.csv. For this post, the file name isAccuracy_bike_demo_auto_export_2020-11-19-00Z_part0.csv.
The wQL, WAPE, and RMSE metrics are provided for the accuracy metric file. Sometimes, output files are split into multiple parts based on the size of the output and are given numbering like part0, part1, and so on.
The following screenshot shows part of the Forecasts_bike_demo_auto_export_2020-11-19-00Z_part0.csv file from the bike dataset backtest exports.

The following screenshot shows part of the Accuracy_bike_demo_auto_export_2020-11-19-00Z_part0.csv file from the bike dataset backtest exports.

- After you finalize your predictor, choose Forecasts in the navigation pane.
- Choose Create a forecast.
- Select your trained predictor to create a forecast.
Visualizing backtest forecasts and item accuracy metrics
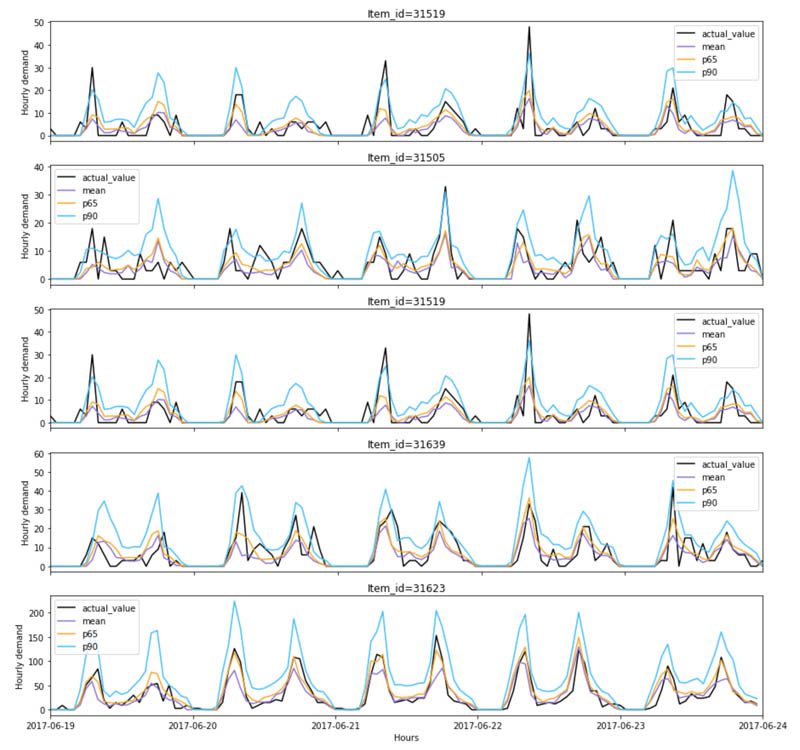
With the backtest forecasts, you can use a visualization tool like Amazon QuickSight to create graphs that help you visualize and compare the forecasts against actuals and graphically assess accuracy. In our notebook, we walk through some visualization examples for your reference. The graph below visualizes the backtest forecasts at different distributions points and the actual observed demand for different items.
Calculating custom metrics
We provide the following model accuracy metrics: weighted quantile loss (wQL) metric, weighted absolute percentage error (WAPE) and root mean square error (RMSE). Now with the export of the backtest forecasts, you can also calculate custom model accuracy metrics such as MAPE using the following formula:

In our notebook, we discuss how you can calculate MAPE and metrics for slow- and fast-moving items.
Tips and best practices
In this section, we share a few tips and best practices when using Forecast:
- Before experimenting with Forecast, define your business problem related to costs of under-forecasting or over-forecasting. Evaluate the trade-offs and prioritize if you would rather over-forecast than under. This helps you determine the forecasting quantile to choose.
- Experiment with multiple distribution points to optimize your forecast model to balance the costs associated with under-forecasting and over-forecasting. Choose a higher quantile if you want to over-forecast to meet demand. The backtest forecasts and accuracy metric files help you assess and optimize the model’s performance against under-forecasting and over-forecasting.
- If you’re comparing different models, use the weighted quantile loss metric at the same quantile for comparison. The lower the value, the more accurate the forecasting model.
- Forecast allows you to select up to five backtest windows. Forecast uses backtesting to tune predictors and produce accuracy metrics. To perform backtesting, Forecast automatically splits your time series datasets into two sets: training and testing. The training set is used to train your model, and the testing set to evaluate the model’s predictive accuracy. We recommend choosing more than one backtest window to minimize selection bias that may make one window more or less accurate by chance. Assessing the overall model accuracy from multiple backtest windows provides a better measure of the strength of the model.
- To create mean forecasts, specify mean as a forecast type. A forecast type of 0.5 refers to the median quantile.
- The wQL metric is not defined for the mean forecast type. However, the WAPE and RMSE metrics are calculated at mean. To view the wQL metric, specify a forecast type of 0.5.
- If you want to calculate a custom metric, such as MAPE, specify mean as a forecast type, and use the backtest forecasts corresponding to mean for this calculation.
Conclusion
Some items may be more important than others in a dataset, and optimizing accuracy for those important items becomes critical. Forecast now supports forecast accuracy measurement for each item separately, enabling you to make better forecasting decisions for items that drive your business metrics. To get started with this capability, see the CreatePredictorBacktestExportJob API. We also have a notebook in our GitHub repo that walks you through how to use the Forecast APIs to export accuracy measurements of each item and calculate accuracy metrics for a custom set of items. You can use this capability in all Regions where Forecast is publicly available. For more information about Region availability, see Region Table.
About the Authors
 Namita Das is a Sr. Product Manager for Amazon Forecast. Her current focus is to democratize machine learning by building no-code/low-code ML services. On the side, she frequently advises startups and is raising a puppy named Imli.
 Punit Jain is working as SDE on the Amazon Forecast team. His current work includes building large scale distributed systems to solve complex machine learning problems with high availability and low latency as a major focus. In his spare time, he enjoys hiking and cycling.
 Christy Bergman is an AI/ML Specialist Solutions Architect at AWS. She helps AWS customers be successful using AI/ML services and solves real world business problems. Prior to joining AWS, Christy worked as a Data Scientist in banking and software industries. In her spare time, she enjoys hiking and bird watching.
Tags: Archive

Leave a Reply